1 Executive Summary
- 1.1 Market overview
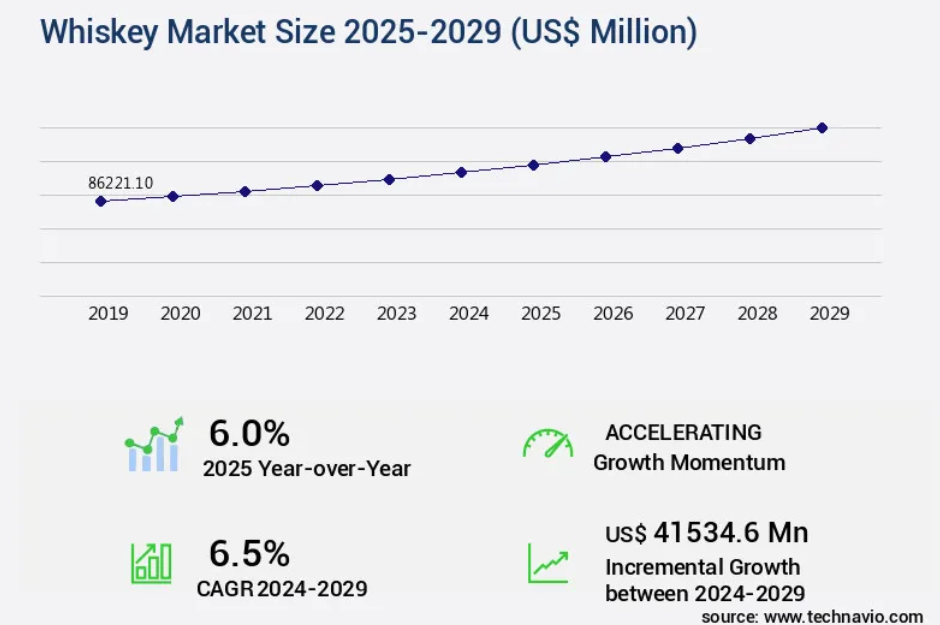
- Executive Summary – Chart on Market Overview
- Executive Summary – Data Table on Market Overview
- Executive Summary – Chart on Global Market Characteristics
- Executive Summary – Chart on Market by Geography
- Executive Summary – Chart on Market Segmentation by Distribution Channel
- Executive Summary – Chart on Market Segmentation by Product
- Executive Summary – Chart on Market Segmentation by Product Type
- Executive Summary – Chart on Incremental Growth
- Executive Summary – Data Table on Incremental Growth
- Executive Summary – Chart on Company Market Positioning
2 Technavio Analysis
- 2.1 Analysis of price sensitivity, lifecycle, customer purchase basket, adoption rates, and purchase criteria
- Analysis of price sensitivity, lifecycle, customer purchase basket, adoption rates, and purchase criteria
- 2.2 Criticality of inputs and Factors of differentiation
- Overview on criticality of inputs and factors of differentiation
- 2.3 Factors of disruption
- Overview on factors of disruption
- 2.4 Impact of drivers and challenges
- Impact of drivers and challenges in 2024 and 2029
3 Market Landscape
- 3.1 Market ecosystem
- Parent Market
- Data Table on – Parent Market
- 3.2 Market characteristics
- Market characteristics analysis
- 3.3 Value chain analysis
- Value chain analysis
4 Market Sizing
- 4.1 Market definition
- Offerings of companies included in the market definition
- 4.2 Market segment analysis
- Market segments
- 4.3 Market size 2024
- 4.4 Market outlook: Forecast for 2024-2029
- Chart on Global – Market size and forecast 2024-2029 ($ million)
- Data Table on Global – Market size and forecast 2024-2029 ($ million)
- Chart on Global Market: Year-over-year growth 2024-2029 (%)
- Data Table on Global Market: Year-over-year growth 2024-2029 (%)
5 Historic Market Size
- 5.1 Global Whiskey Market 2019 – 2023
- Historic Market Size – Data Table on Global Whiskey Market 2019 – 2023 ($ million)
- 5.2 Distribution Channel segment analysis 2019 – 2023
- Historic Market Size – Distribution Channel Segment 2019 – 2023 ($ million)
- 5.3 Product segment analysis 2019 – 2023
- Historic Market Size – Product Segment 2019 – 2023 ($ million)
- 5.4 Product Type segment analysis 2019 – 2023
- Historic Market Size – Product Type Segment 2019 – 2023 ($ million)
- 5.5 Geography segment analysis 2019 – 2023
- Historic Market Size – Geography Segment 2019 – 2023 ($ million)
- 5.6 Country segment analysis 2019 – 2023
- Historic Market Size – Country Segment 2019 – 2023 ($ million)
6 Qualitative Analysis
- 6.1 Impact of AI on global whiskey market
7 Five Forces Analysis
- 7.1 Five forces summary
- Five forces analysis – Comparison between 2024 and 2029
- 7.2 Bargaining power of buyers
- Bargaining power of buyers – Impact of key factors 2024 and 2029
- 7.3 Bargaining power of suppliers
- Bargaining power of suppliers – Impact of key factors in 2024 and 2029
- 7.4 Threat of new entrants
- Threat of new entrants – Impact of key factors in 2024 and 2029
- 7.5 Threat of substitutes
- Threat of substitutes – Impact of key factors in 2024 and 2029
- 7.6 Threat of rivalry
- Threat of rivalry – Impact of key factors in 2024 and 2029
- 7.7 Market condition
- Chart on Market condition – Five forces 2024 and 2029
8 Market Segmentation by Distribution Channel
- 8.1 Market segments
- Chart on Distribution Channel – Market share 2024-2029 (%)
- Data Table on Distribution Channel – Market share 2024-2029 (%)
- 8.2 Comparison by Distribution Channel
- Chart on Comparison by Distribution Channel
- Data Table on Comparison by Distribution Channel
- 8.3 Off trade – Market size and forecast 2024-2029
- Chart on Off trade – Market size and forecast 2024-2029 ($ million)
- Data Table on Off trade – Market size and forecast 2024-2029 ($ million)
- Chart on Off trade – Year-over-year growth 2024-2029 (%)
- Data Table on Off trade – Year-over-year growth 2024-2029 (%)
- 8.4 On trade – Market size and forecast 2024-2029
- Chart on On trade – Market size and forecast 2024-2029 ($ million)
- Data Table on On trade – Market size and forecast 2024-2029 ($ million)
- Chart on On trade – Year-over-year growth 2024-2029 (%)
- Data Table on On trade – Year-over-year growth 2024-2029 (%)
- 8.5 Market opportunity by Distribution Channel
- Market opportunity by Distribution Channel ($ million)
- Data Table on Market opportunity by Distribution Channel ($ million)
9 Market Segmentation by Product
- 9.1 Market segments
- Chart on Product – Market share 2024-2029 (%)
- Data Table on Product – Market share 2024-2029 (%)
- 9.2 Comparison by Product
- Chart on Comparison by Product
- Data Table on Comparison by Product
- 9.3 Scotch whiskey – Market size and forecast 2024-2029
- Chart on Scotch whiskey – Market size and forecast 2024-2029 ($ million)
- Data Table on Scotch whiskey – Market size and forecast 2024-2029 ($ million)
- Chart on Scotch whiskey – Year-over-year growth 2024-2029 (%)
- Data Table on Scotch whiskey – Year-over-year growth 2024-2029 (%)
- 9.4 American whiskey – Market size and forecast 2024-2029
- Chart on American whiskey – Market size and forecast 2024-2029 ($ million)
- Data Table on American whiskey – Market size and forecast 2024-2029 ($ million)
- Chart on American whiskey – Year-over-year growth 2024-2029 (%)
- Data Table on American whiskey – Year-over-year growth 2024-2029 (%)
- 9.5 Canadian whiskey – Market size and forecast 2024-2029
- Chart on Canadian whiskey – Market size and forecast 2024-2029 ($ million)
- Data Table on Canadian whiskey – Market size and forecast 2024-2029 ($ million)
- Chart on Canadian whiskey – Year-over-year growth 2024-2029 (%)
- Data Table on Canadian whiskey – Year-over-year growth 2024-2029 (%)
- 9.6 Irish whiskey – Market size and forecast 2024-2029
- Chart on Irish whiskey – Market size and forecast 2024-2029 ($ million)
- Data Table on Irish whiskey – Market size and forecast 2024-2029 ($ million)
- Chart on Irish whiskey – Year-over-year growth 2024-2029 (%)
- Data Table on Irish whiskey – Year-over-year growth 2024-2029 (%)
- 9.7 Others – Market size and forecast 2024-2029
- Chart on Others – Market size and forecast 2024-2029 ($ million)
- Data Table on Others – Market size and forecast 2024-2029 ($ million)
- Chart on Others – Year-over-year growth 2024-2029 (%)
- Data Table on Others – Year-over-year growth 2024-2029 (%)
- 9.8 Market opportunity by Product
- Market opportunity by Product ($ million)
- Data Table on Market opportunity by Product ($ million)
10 Market Segmentation by Product Type
- 10.1 Market segments
- Chart on Product Type – Market share 2024-2029 (%)
- Data Table on Product Type – Market share 2024-2029 (%)
- 10.2 Comparison by Product Type
- Chart on Comparison by Product Type
- Data Table on Comparison by Product Type
- 10.3 Malt – Market size and forecast 2024-2029
- Chart on Malt – Market size and forecast 2024-2029 ($ million)
- Data Table on Malt – Market size and forecast 2024-2029 ($ million)
- Chart on Malt – Year-over-year growth 2024-2029 (%)
- Data Table on Malt – Year-over-year growth 2024-2029 (%)
- 10.4 Blended – Market size and forecast 2024-2029
- Chart on Blended – Market size and forecast 2024-2029 ($ million)
- Data Table on Blended – Market size and forecast 2024-2029 ($ million)
- Chart on Blended – Year-over-year growth 2024-2029 (%)
- Data Table on Blended – Year-over-year growth 2024-2029 (%)
- 10.5 Wheat – Market size and forecast 2024-2029
- Chart on Wheat – Market size and forecast 2024-2029 ($ million)
- Data Table on Wheat – Market size and forecast 2024-2029 ($ million)
- Chart on Wheat – Year-over-year growth 2024-2029 (%)
- Data Table on Wheat – Year-over-year growth 2024-2029 (%)
- 10.6 Rye – Market size and forecast 2024-2029
- Chart on Rye – Market size and forecast 2024-2029 ($ million)
- Data Table on Rye – Market size and forecast 2024-2029 ($ million)
- Chart on Rye – Year-over-year growth 2024-2029 (%)
- Data Table on Rye – Year-over-year growth 2024-2029 (%)
- 10.7 Others – Market size and forecast 2024-2029
- Chart on Others – Market size and forecast 2024-2029 ($ million)
- Data Table on Others – Market size and forecast 2024-2029 ($ million)
- Chart on Others – Year-over-year growth 2024-2029 (%)
- Data Table on Others – Year-over-year growth 2024-2029 (%)
- 10.8 Market opportunity by Product Type
- Market opportunity by Product Type ($ million)
- Data Table on Market opportunity by Product Type ($ million)
11 Customer Landscape
- 11.1 Customer landscape overview
- Analysis of price sensitivity, lifecycle, customer purchase basket, adoption rates, and purchase criteria
12 Geographic Landscape
- 12.1 Geographic segmentation
- Chart on Market share by geography 2024-2029 (%)
- Data Table on Market share by geography 2024-2029 (%)
- 12.2 Geographic comparison
- Chart on Geographic comparison
- Data Table on Geographic comparison
- 12.3 APAC – Market size and forecast 2024-2029
- Chart on APAC – Market size and forecast 2024-2029 ($ million)
- Data Table on APAC – Market size and forecast 2024-2029 ($ million)
- Chart on APAC – Year-over-year growth 2024-2029 (%)
- Data Table on APAC – Year-over-year growth 2024-2029 (%)
- 12.4 North America – Market size and forecast 2024-2029
- Chart on North America – Market size and forecast 2024-2029 ($ million)
- Data Table on North America – Market size and forecast 2024-2029 ($ million)
- Chart on North America – Year-over-year growth 2024-2029 (%)
- Data Table on North America – Year-over-year growth 2024-2029 (%)
- 12.5 Europe – Market size and forecast 2024-2029
- Chart on Europe – Market size and forecast 2024-2029 ($ million)
- Data Table on Europe – Market size and forecast 2024-2029 ($ million)
- Chart on Europe – Year-over-year growth 2024-2029 (%)
- Data Table on Europe – Year-over-year growth 2024-2029 (%)
- 12.6 South America – Market size and forecast 2024-2029
- Chart on South America – Market size and forecast 2024-2029 ($ million)
- Data Table on South America – Market size and forecast 2024-2029 ($ million)
- Chart on South America – Year-over-year growth 2024-2029 (%)
- Data Table on South America – Year-over-year growth 2024-2029 (%)
- 12.7 Middle East and Africa – Market size and forecast 2024-2029
- Chart on Middle East and Africa – Market size and forecast 2024-2029 ($ million)
- Data Table on Middle East and Africa – Market size and forecast 2024-2029 ($ million)
- Chart on Middle East and Africa – Year-over-year growth 2024-2029 (%)
- Data Table on Middle East and Africa – Year-over-year growth 2024-2029 (%)
- 12.8 US – Market size and forecast 2024-2029
- Chart on US – Market size and forecast 2024-2029 ($ million)
- Data Table on US – Market size and forecast 2024-2029 ($ million)
- Chart on US – Year-over-year growth 2024-2029 (%)
- Data Table on US – Year-over-year growth 2024-2029 (%)
- 12.9 India – Market size and forecast 2024-2029
- Chart on India – Market size and forecast 2024-2029 ($ million)
- Data Table on India – Market size and forecast 2024-2029 ($ million)
- Chart on India – Year-over-year growth 2024-2029 (%)
- Data Table on India – Year-over-year growth 2024-2029 (%)
- 12.10 China – Market size and forecast 2024-2029
- Chart on China – Market size and forecast 2024-2029 ($ million)
- Data Table on China – Market size and forecast 2024-2029 ($ million)
- Chart on China – Year-over-year growth 2024-2029 (%)
- Data Table on China – Year-over-year growth 2024-2029 (%)
- 12.11 Japan – Market size and forecast 2024-2029
- Chart on Japan – Market size and forecast 2024-2029 ($ million)
- Data Table on Japan – Market size and forecast 2024-2029 ($ million)
- Chart on Japan – Year-over-year growth 2024-2029 (%)
- Data Table on Japan – Year-over-year growth 2024-2029 (%)
- 12.12 South Korea – Market size and forecast 2024-2029
- Chart on South Korea – Market size and forecast 2024-2029 ($ million)
- Data Table on South Korea – Market size and forecast 2024-2029 ($ million)
- Chart on South Korea – Year-over-year growth 2024-2029 (%)
- Data Table on South Korea – Year-over-year growth 2024-2029 (%)
- 12.13 France – Market size and forecast 2024-2029
- Chart on France – Market size and forecast 2024-2029 ($ million)
- Data Table on France – Market size and forecast 2024-2029 ($ million)
- Chart on France – Year-over-year growth 2024-2029 (%)
- Data Table on France – Year-over-year growth 2024-2029 (%)
- 12.14 Canada – Market size and forecast 2024-2029
- Chart on Canada – Market size and forecast 2024-2029 ($ million)
- Data Table on Canada – Market size and forecast 2024-2029 ($ million)
- Chart on Canada – Year-over-year growth 2024-2029 (%)
- Data Table on Canada – Year-over-year growth 2024-2029 (%)
- 12.15 UK – Market size and forecast 2024-2029
- Chart on UK – Market size and forecast 2024-2029 ($ million)
- Data Table on UK – Market size and forecast 2024-2029 ($ million)
- Chart on UK – Year-over-year growth 2024-2029 (%)
- Data Table on UK – Year-over-year growth 2024-2029 (%)
- 12.16 Germany – Market size and forecast 2024-2029
- Chart on Germany – Market size and forecast 2024-2029 ($ million)
- Data Table on Germany – Market size and forecast 2024-2029 ($ million)
- Chart on Germany – Year-over-year growth 2024-2029 (%)
- Data Table on Germany – Year-over-year growth 2024-2029 (%)
- 12.17 Italy – Market size and forecast 2024-2029
- Chart on Italy – Market size and forecast 2024-2029 ($ million)
- Data Table on Italy – Market size and forecast 2024-2029 ($ million)
- Chart on Italy – Year-over-year growth 2024-2029 (%)
- Data Table on Italy – Year-over-year growth 2024-2029 (%)
- 12.18 Market opportunity by geography
- Market opportunity by geography ($ million)
- Data Tables on Market opportunity by geography ($ million)
13 Drivers, Challenges, and Opportunity/Restraints
- 13.1 Market drivers
- 13.2 Market challenges
- 13.3 Impact of drivers and challenges
- Impact of drivers and challenges in 2024 and 2029
- 13.4 Market opportunities/restraints
14 Competitive Landscape
- 14.1 Overview
- 14.2 Competitive Landscape
- Overview on criticality of inputs and factors of differentiation
- 14.3 Landscape disruption
- Overview on factors of disruption
- 14.4 Industry risks
- Impact of key risks on business
15 Competitive Analysis
- 15.1 Companies profiled
- Companies covered
- 15.2 Company ranking index
- Company ranking index
- 15.3 Market positioning of companies
- Matrix on companies position and classification
- 15.4 Allied Blenders and Distillers Ltd
- Allied Blenders and Distillers Ltd – Overview
- Allied Blenders and Distillers Ltd – Product / Service
- Allied Blenders and Distillers Ltd – Key offerings
- SWOT
- 15.5 Asahi Group Holdings Ltd.
- Asahi Group Holdings Ltd. – Overview
- Asahi Group Holdings Ltd. – Business segments
- Asahi Group Holdings Ltd. – Key news
- Asahi Group Holdings Ltd. – Key offerings
- Asahi Group Holdings Ltd. – Segment focus
- SWOT
- 15.6 Bacardi and Co. Ltd.
- Bacardi and Co. Ltd. – Overview
- Bacardi and Co. Ltd. – Product / Service
- Bacardi and Co. Ltd. – Key news
- Bacardi and Co. Ltd. – Key offerings
- SWOT
- 15.7 Beam Suntory Inc.
- Beam Suntory Inc. – Overview
- Beam Suntory Inc. – Product / Service
- Beam Suntory Inc. – Key offerings
- SWOT
- 15.8 Brown Forman Corp.
- Brown Forman Corp. – Overview
- Brown Forman Corp. – Product / Service
- Brown Forman Corp. – Key offerings
- SWOT
- 15.9 Campari Group
- Campari Group – Overview
- Campari Group – Business segments
- Campari Group – Key offerings
- Campari Group – Segment focus
- SWOT
- 15.10 Constellation Brands Inc.
- Constellation Brands Inc. – Overview
- Constellation Brands Inc. – Business segments
- Constellation Brands Inc. – Key offerings
- Constellation Brands Inc. – Segment focus
- SWOT
- 15.11 Diageo PLC
- Diageo PLC – Overview
- Diageo PLC – Business segments
- Diageo PLC – Key news
- Diageo PLC – Key offerings
- Diageo PLC – Segment focus
- SWOT
- 15.12 Heaven Hill Distillery Inc.
- Heaven Hill Distillery Inc. – Overview
- Heaven Hill Distillery Inc. – Product / Service
- Heaven Hill Distillery Inc. – Key offerings
- SWOT
- 15.13 John Distilleries Pvt. Ltd.
- John Distilleries Pvt. Ltd. – Overview
- John Distilleries Pvt. Ltd. – Product / Service
- John Distilleries Pvt. Ltd. – Key offerings
- SWOT
- 15.14 Kirin Holdings Co. Ltd.
- Kirin Holdings Co. Ltd. – Overview
- Kirin Holdings Co. Ltd. – Business segments
- Kirin Holdings Co. Ltd. – Key offerings
- Kirin Holdings Co. Ltd. – Segment focus
- SWOT
- 15.15 Luxco Inc.
- Luxco Inc. – Overview
- Luxco Inc. – Product / Service
- Luxco Inc. – Key offerings
- SWOT
- 15.16 LVMH Moet Hennessy Louis Vuitton SE
- LVMH Moet Hennessy Louis Vuitton SE – Overview
- LVMH Moet Hennessy Louis Vuitton SE – Business segments
- LVMH Moet Hennessy Louis Vuitton SE – Key news
- LVMH Moet Hennessy Louis Vuitton SE – Key offerings
- LVMH Moet Hennessy Louis Vuitton SE – Segment focus
- SWOT
- 15.17 Pernod Ricard SA
- Pernod Ricard SA – Overview
- Pernod Ricard SA – Product / Service
- Pernod Ricard SA – Key news
- Pernod Ricard SA – Key offerings
- SWOT
- 15.18 William Grant and Sons Ltd.
- William Grant and Sons Ltd. – Overview
- William Grant and Sons Ltd. – Product / Service
- William Grant and Sons Ltd. – Key offerings
- SWOT
16 Appendix
- 16.1 Scope of the report
- 16.2 Inclusions and exclusions checklist
- Inclusions checklist
- Exclusions checklist
- 16.3 Currency conversion rates for US$
- Currency conversion rates for US$
- 16.4 Research methodology
- Research methodology
- 16.5 Data procurement
- Information sources
- 16.6 Data validation
- Data validation
- 16.7 Validation techniques employed for market sizing
- Validation techniques employed for market sizing
- 16.8 Data synthesis
- Data synthesis
- 16.9 360 degree market analysis
- 360 degree market analysis
- 16.10 List of abbreviations
- List of abbreviations


