1 Executive Summary
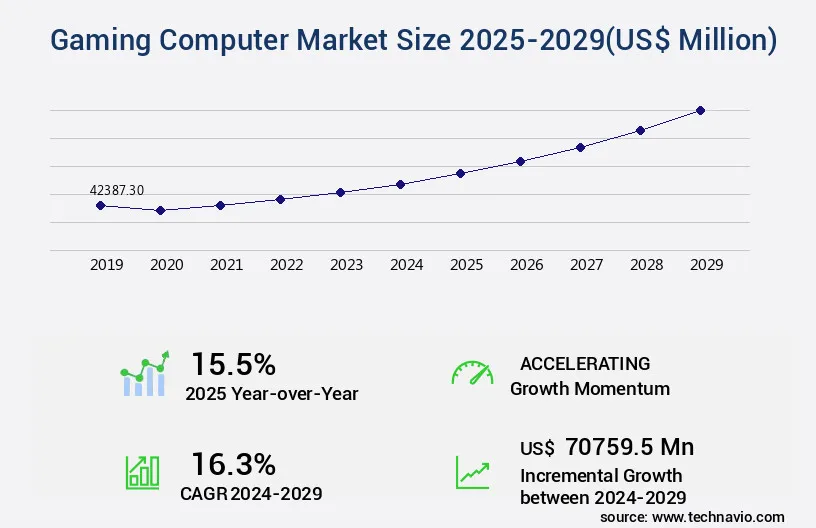
- 1.1 Market overview
- Executive Summary – Chart on Market Overview
- Executive Summary – Data Table on Market Overview
- Executive Summary – Chart on Global Market Characteristics
- Executive Summary – Chart on Market by Geography
- Executive Summary – Chart on Market Segmentation by Distribution Channel
- Executive Summary – Chart on Market Segmentation by Product
- Executive Summary – Chart on Market Segmentation by End-user
- Executive Summary – Chart on Incremental Growth
- Executive Summary – Data Table on Incremental Growth
- Executive Summary – Chart on Company Market Positioning
2 Technavio Analysis
- 2.1 Analysis of price sensitivity, lifecycle, customer purchase basket, adoption rates, and purchase criteria
- Analysis of price sensitivity, lifecycle, customer purchase basket, adoption rates, and purchase criteria
- 2.2 Criticality of inputs and Factors of differentiation
- Overview on criticality of inputs and factors of differentiation
- 2.3 Factors of disruption
- Overview on factors of disruption
- 2.4 Impact of drivers and challenges
- Impact of drivers and challenges in 2024 and 2029
3 Market Landscape
- 3.1 Market ecosystem
- Parent Market
- Data Table on – Parent Market
- 3.2 Market characteristics
- Market characteristics analysis
- 3.3 Value chain analysis
- Value chain analysis
4 Market Sizing
- 4.1 Market definition
- Offerings of companies included in the market definition
- 4.2 Market segment analysis
- Market segments
- 4.3 Market size 2024
- 4.4 Market outlook: Forecast for 2024-2029
- Chart on Global – Market size and forecast 2024-2029 ($ million)
- Data Table on Global – Market size and forecast 2024-2029 ($ million)
- Chart on Global Market: Year-over-year growth 2024-2029 (%)
- Data Table on Global Market: Year-over-year growth 2024-2029 (%)
5 Historic Market Size
- 5.1 Global Gaming Computer Market 2019 – 2023
- Historic Market Size – Data Table on Global Gaming Computer Market 2019 – 2023 ($ million)
- 5.2 Distribution Channel segment analysis 2019 – 2023
- Historic Market Size – Distribution Channel Segment 2019 – 2023 ($ million)
- 5.3 Product segment analysis 2019 – 2023
- Historic Market Size – Product Segment 2019 – 2023 ($ million)
- 5.4 End-user segment analysis 2019 – 2023
- Historic Market Size – End-user Segment 2019 – 2023 ($ million)
- 5.5 Geography segment analysis 2019 – 2023
- Historic Market Size – Geography Segment 2019 – 2023 ($ million)
- 5.6 Country segment analysis 2019 – 2023
- Historic Market Size – Country Segment 2019 – 2023 ($ million)
6 Qualitative Analysis
- 6.1 The AI impact on Global Gaming Computer Market
7 Five Forces Analysis
- 7.1 Five forces summary
- Five forces analysis – Comparison between 2024 and 2029
- 7.2 Bargaining power of buyers
- Bargaining power of buyers – Impact of key factors 2024 and 2029
- 7.3 Bargaining power of suppliers
- Bargaining power of suppliers – Impact of key factors in 2024 and 2029
- 7.4 Threat of new entrants
- Threat of new entrants – Impact of key factors in 2024 and 2029
- 7.5 Threat of substitutes
- Threat of substitutes – Impact of key factors in 2024 and 2029
- 7.6 Threat of rivalry
- Threat of rivalry – Impact of key factors in 2024 and 2029
- 7.7 Market condition
- Chart on Market condition – Five forces 2024 and 2029
8 Market Segmentation by Distribution Channel
- 8.1 Market segments
- Chart on Distribution Channel – Market share 2024-2029 (%)
- Data Table on Distribution Channel – Market share 2024-2029 (%)
- 8.2 Comparison by Distribution Channel
- Chart on Comparison by Distribution Channel
- Data Table on Comparison by Distribution Channel
- 8.3 Offline – Market size and forecast 2024-2029
- Chart on Offline – Market size and forecast 2024-2029 ($ million)
- Data Table on Offline – Market size and forecast 2024-2029 ($ million)
- Chart on Offline – Year-over-year growth 2024-2029 (%)
- Data Table on Offline – Year-over-year growth 2024-2029 (%)
- 8.4 Online – Market size and forecast 2024-2029
- Chart on Online – Market size and forecast 2024-2029 ($ million)
- Data Table on Online – Market size and forecast 2024-2029 ($ million)
- Chart on Online – Year-over-year growth 2024-2029 (%)
- Data Table on Online – Year-over-year growth 2024-2029 (%)
- 8.5 Market opportunity by Distribution Channel
- Market opportunity by Distribution Channel ($ million)
- Data Table on Market opportunity by Distribution Channel ($ million)
9 Market Segmentation by Product
- 9.1 Market segments
- Chart on Product – Market share 2024-2029 (%)
- Data Table on Product – Market share 2024-2029 (%)
- 9.2 Comparison by Product
- Chart on Comparison by Product
- Data Table on Comparison by Product
- 9.3 Desktop – Market size and forecast 2024-2029
- Chart on Desktop – Market size and forecast 2024-2029 ($ million)
- Data Table on Desktop – Market size and forecast 2024-2029 ($ million)
- Chart on Desktop – Year-over-year growth 2024-2029 (%)
- Data Table on Desktop – Year-over-year growth 2024-2029 (%)
- 9.4 Laptop – Market size and forecast 2024-2029
- Chart on Laptop – Market size and forecast 2024-2029 ($ million)
- Data Table on Laptop – Market size and forecast 2024-2029 ($ million)
- Chart on Laptop – Year-over-year growth 2024-2029 (%)
- Data Table on Laptop – Year-over-year growth 2024-2029 (%)
- 9.5 Market opportunity by Product
- Market opportunity by Product ($ million)
- Data Table on Market opportunity by Product ($ million)
10 Market Segmentation by End-user
- 10.1 Market segments
- Chart on End-user – Market share 2024-2029 (%)
- Data Table on End-user – Market share 2024-2029 (%)
- 10.2 Comparison by End-user
- Chart on Comparison by End-user
- Data Table on Comparison by End-user
- 10.3 Professional gamers – Market size and forecast 2024-2029
- Chart on Professional gamers – Market size and forecast 2024-2029 ($ million)
- Data Table on Professional gamers – Market size and forecast 2024-2029 ($ million)
- Chart on Professional gamers – Year-over-year growth 2024-2029 (%)
- Data Table on Professional gamers – Year-over-year growth 2024-2029 (%)
- 10.4 Casual gamers – Market size and forecast 2024-2029
- Chart on Casual gamers – Market size and forecast 2024-2029 ($ million)
- Data Table on Casual gamers – Market size and forecast 2024-2029 ($ million)
- Chart on Casual gamers – Year-over-year growth 2024-2029 (%)
- Data Table on Casual gamers – Year-over-year growth 2024-2029 (%)
- 10.5 Game developers – Market size and forecast 2024-2029
- Chart on Game developers – Market size and forecast 2024-2029 ($ million)
- Data Table on Game developers – Market size and forecast 2024-2029 ($ million)
- Chart on Game developers – Year-over-year growth 2024-2029 (%)
- Data Table on Game developers – Year-over-year growth 2024-2029 (%)
- 10.6 Others – Market size and forecast 2024-2029
- Chart on Others – Market size and forecast 2024-2029 ($ million)
- Data Table on Others – Market size and forecast 2024-2029 ($ million)
- Chart on Others – Year-over-year growth 2024-2029 (%)
- Data Table on Others – Year-over-year growth 2024-2029 (%)
- 10.7 Market opportunity by End-user
- Market opportunity by End-user ($ million)
- Data Table on Market opportunity by End-user ($ million)
11 Customer Landscape
- 11.1 Customer landscape overview
- Analysis of price sensitivity, lifecycle, customer purchase basket, adoption rates, and purchase criteria
12 Geographic Landscape
- 12.1 Geographic segmentation
- Chart on Market share by geography 2024-2029 (%)
- Data Table on Market share by geography 2024-2029 (%)
- 12.2 Geographic comparison
- Chart on Geographic comparison
- Data Table on Geographic comparison
- 12.3 North America – Market size and forecast 2024-2029
- Chart on North America – Market size and forecast 2024-2029 ($ million)
- Data Table on North America – Market size and forecast 2024-2029 ($ million)
- Chart on North America – Year-over-year growth 2024-2029 (%)
- Data Table on North America – Year-over-year growth 2024-2029 (%)
- 12.4 Europe – Market size and forecast 2024-2029
- Chart on Europe – Market size and forecast 2024-2029 ($ million)
- Data Table on Europe – Market size and forecast 2024-2029 ($ million)
- Chart on Europe – Year-over-year growth 2024-2029 (%)
- Data Table on Europe – Year-over-year growth 2024-2029 (%)
- 12.5 APAC – Market size and forecast 2024-2029
- Chart on APAC – Market size and forecast 2024-2029 ($ million)
- Data Table on APAC – Market size and forecast 2024-2029 ($ million)
- Chart on APAC – Year-over-year growth 2024-2029 (%)
- Data Table on APAC – Year-over-year growth 2024-2029 (%)
- 12.6 Middle East and Africa – Market size and forecast 2024-2029
- Chart on Middle East and Africa – Market size and forecast 2024-2029 ($ million)
- Data Table on Middle East and Africa – Market size and forecast 2024-2029 ($ million)
- Chart on Middle East and Africa – Year-over-year growth 2024-2029 (%)
- Data Table on Middle East and Africa – Year-over-year growth 2024-2029 (%)
- 12.7 South America – Market size and forecast 2024-2029
- Chart on South America – Market size and forecast 2024-2029 ($ million)
- Data Table on South America – Market size and forecast 2024-2029 ($ million)
- Chart on South America – Year-over-year growth 2024-2029 (%)
- Data Table on South America – Year-over-year growth 2024-2029 (%)
- 12.8 US – Market size and forecast 2024-2029
- Chart on US – Market size and forecast 2024-2029 ($ million)
- Data Table on US – Market size and forecast 2024-2029 ($ million)
- Chart on US – Year-over-year growth 2024-2029 (%)
- Data Table on US – Year-over-year growth 2024-2029 (%)
- 12.9 China – Market size and forecast 2024-2029
- Chart on China – Market size and forecast 2024-2029 ($ million)
- Data Table on China – Market size and forecast 2024-2029 ($ million)
- Chart on China – Year-over-year growth 2024-2029 (%)
- Data Table on China – Year-over-year growth 2024-2029 (%)
- 12.10 Germany – Market size and forecast 2024-2029
- Chart on Germany – Market size and forecast 2024-2029 ($ million)
- Data Table on Germany – Market size and forecast 2024-2029 ($ million)
- Chart on Germany – Year-over-year growth 2024-2029 (%)
- Data Table on Germany – Year-over-year growth 2024-2029 (%)
- 12.11 Japan – Market size and forecast 2024-2029
- Chart on Japan – Market size and forecast 2024-2029 ($ million)
- Data Table on Japan – Market size and forecast 2024-2029 ($ million)
- Chart on Japan – Year-over-year growth 2024-2029 (%)
- Data Table on Japan – Year-over-year growth 2024-2029 (%)
- 12.12 UK – Market size and forecast 2024-2029
- Chart on UK – Market size and forecast 2024-2029 ($ million)
- Data Table on UK – Market size and forecast 2024-2029 ($ million)
- Chart on UK – Year-over-year growth 2024-2029 (%)
- Data Table on UK – Year-over-year growth 2024-2029 (%)
- 12.13 Canada – Market size and forecast 2024-2029
- Chart on Canada – Market size and forecast 2024-2029 ($ million)
- Data Table on Canada – Market size and forecast 2024-2029 ($ million)
- Chart on Canada – Year-over-year growth 2024-2029 (%)
- Data Table on Canada – Year-over-year growth 2024-2029 (%)
- 12.14 France – Market size and forecast 2024-2029
- Chart on France – Market size and forecast 2024-2029 ($ million)
- Data Table on France – Market size and forecast 2024-2029 ($ million)
- Chart on France – Year-over-year growth 2024-2029 (%)
- Data Table on France – Year-over-year growth 2024-2029 (%)
- 12.15 Italy – Market size and forecast 2024-2029
- Chart on Italy – Market size and forecast 2024-2029 ($ million)
- Data Table on Italy – Market size and forecast 2024-2029 ($ million)
- Chart on Italy – Year-over-year growth 2024-2029 (%)
- Data Table on Italy – Year-over-year growth 2024-2029 (%)
- 12.16 India – Market size and forecast 2024-2029
- Chart on India – Market size and forecast 2024-2029 ($ million)
- Data Table on India – Market size and forecast 2024-2029 ($ million)
- Chart on India – Year-over-year growth 2024-2029 (%)
- Data Table on India – Year-over-year growth 2024-2029 (%)
- 12.17 Spain – Market size and forecast 2024-2029
- Chart on Spain – Market size and forecast 2024-2029 ($ million)
- Data Table on Spain – Market size and forecast 2024-2029 ($ million)
- Chart on Spain – Year-over-year growth 2024-2029 (%)
- Data Table on Spain – Year-over-year growth 2024-2029 (%)
- 12.18 Market opportunity by geography
- Market opportunity by geography ($ million)
- Data Tables on Market opportunity by geography ($ million)
13 Drivers, Challenges, and Opportunity/Restraints
- 13.1 Market drivers
- 13.2 Market challenges
- 13.3 Impact of drivers and challenges
- Impact of drivers and challenges in 2024 and 2029
- 13.4 Market opportunities/restraints
14 Competitive Landscape
- 14.1 Overview
- 14.2 Competitive Landscape
- Overview on criticality of inputs and factors of differentiation
- 14.3 Landscape disruption
- Overview on factors of disruption
- 14.4 Industry risks
- Impact of key risks on business
15 Competitive Analysis
- 15.1 Companies profiled
- Companies covered
- 15.2 Company ranking index
- Company ranking index
- 15.3 Market positioning of companies
- Matrix on companies position and classification
- 15.4 Acer Inc.
- Acer Inc. – Overview
- Acer Inc. – Business segments
- Acer Inc. – Key news
- Acer Inc. – Key offerings
- Acer Inc. – Segment focus
- SWOT
- 15.5 Apple Inc.
- Apple Inc. – Overview
- Apple Inc. – Business segments
- Apple Inc. – Key news
- Apple Inc. – Key offerings
- Apple Inc. – Segment focus
- SWOT
- 15.6 ASUSTeK Computer Inc.
- ASUSTeK Computer Inc. – Overview
- ASUSTeK Computer Inc. – Product / Service
- ASUSTeK Computer Inc. – Key news
- ASUSTeK Computer Inc. – Key offerings
- SWOT
- 15.7 Corsair Gaming Inc.
- Corsair Gaming Inc. – Overview
- Corsair Gaming Inc. – Business segments
- Corsair Gaming Inc. – Key offerings
- Corsair Gaming Inc. – Segment focus
- SWOT
- 15.8 CyberPowerPC
- CyberPowerPC – Overview
- CyberPowerPC – Product / Service
- CyberPowerPC – Key offerings
- SWOT
- 15.9 Dell Technologies Inc.
- Dell Technologies Inc. – Overview
- Dell Technologies Inc. – Business segments
- Dell Technologies Inc. – Key news
- Dell Technologies Inc. – Key offerings
- Dell Technologies Inc. – Segment focus
- SWOT
- 15.10 Gigabyte Technology Co. Ltd.
- Gigabyte Technology Co. Ltd. – Overview
- Gigabyte Technology Co. Ltd. – Product / Service
- Gigabyte Technology Co. Ltd. – Key offerings
- SWOT
- 15.11 HP Inc.
- HP Inc. – Overview
- HP Inc. – Business segments
- HP Inc. – Key news
- HP Inc. – Key offerings
- HP Inc. – Segment focus
- SWOT
- 15.12 Lenovo Group Ltd.
- Lenovo Group Ltd. – Overview
- Lenovo Group Ltd. – Business segments
- Lenovo Group Ltd. – Key news
- Lenovo Group Ltd. – Key offerings
- Lenovo Group Ltd. – Segment focus
- SWOT
- 15.13 Micro Star International Co. Ltd.
- Micro Star International Co. Ltd. – Overview
- Micro Star International Co. Ltd. – Product / Service
- Micro Star International Co. Ltd. – Key offerings
- SWOT
- 15.14 Microsoft Corp.
- Microsoft Corp. – Overview
- Microsoft Corp. – Business segments
- Microsoft Corp. – Key news
- Microsoft Corp. – Key offerings
- Microsoft Corp. – Segment focus
- SWOT
- 15.15 NVIDIA Corp.
- NVIDIA Corp. – Overview
- NVIDIA Corp. – Business segments
- NVIDIA Corp. – Key news
- NVIDIA Corp. – Key offerings
- NVIDIA Corp. – Segment focus
- SWOT
- 15.16 Razer Inc.
- Razer Inc. – Overview
- Razer Inc. – Product / Service
- Razer Inc. – Key news
- Razer Inc. – Key offerings
- SWOT
- 15.17 Samsung Electronics Co. Ltd.
- Samsung Electronics Co. Ltd. – Overview
- Samsung Electronics Co. Ltd. – Business segments
- Samsung Electronics Co. Ltd. – Key news
- Samsung Electronics Co. Ltd. – Key offerings
- Samsung Electronics Co. Ltd. – Segment focus
- SWOT
- 15.18 Xiaomi Inc.
- Xiaomi Inc. – Overview
- Xiaomi Inc. – Business segments
- Xiaomi Inc. – Key news
- Xiaomi Inc. – Key offerings
- Xiaomi Inc. – Segment focus
- SWOT
16 Appendix


