1 Preface
2 Scope and Methodology
2.1 Objectives of the Study
2.2 Stakeholders
2.3 Data Sources
2.3.1 Primary Sources
2.3.2 Secondary Sources
2.4 Market Estimation
2.4.1 Bottom-Up Approach
2.4.2 Top-Down Approach
2.5 Forecasting Methodology
3 Executive Summary
4 Introduction
4.1 Overview
4.2 Key Industry Trends
5 Global Biogas Plant Market
5.1 Market Overview
5.2 Market Performance
5.3 Impact of COVID-19
5.4 Market Forecast
6 Market Breakup by Biogas Plant Type
6.1 Small-scale Digesters
6.1.1 Market Trends
6.1.2 Market Forecast
6.2 Medium-to-Large-scale Digesters
6.2.1 Market Trends
6.2.2 Market Forecast
7 Market Breakup by Feedstock
7.1 Agricultural Waste
7.1.1 Market Trends
7.1.2 Market Forecast
7.2 Industrial Waste
7.2.1 Market Trends
7.2.2 Market Forecast
7.3 Sewage Sludge
7.3.1 Market Trends
7.3.2 Market Forecast
7.4 Others
7.4.1 Market Trends
7.4.2 Market Forecast
8 Market Breakup by Digestor Type
8.1 Wet Anaerobic Digestion
8.1.1 Market Trends
8.1.2 Market Forecast
8.2 Dry Anaerobic Digestion
8.2.1 Market Trends
8.2.2 Market Forecast
9 Market Breakup by Application
9.1 Electricity Generation
9.1.1 Market Trends
9.1.2 Market Forecast
9.2 Biofuel Generation
9.2.1 Market Trends
9.2.2 Market Forecast
9.3 Heat Generation
9.3.1 Market Trends
9.3.2 Market Forecast
10 Market Breakup by Region
10.1 North America
10.1.1 United States
10.1.1.1 Market Trends
10.1.1.2 Market Forecast
10.1.2 Canada
10.1.2.1 Market Trends
10.1.2.2 Market Forecast
10.2 Asia-Pacific
10.2.1 China
10.2.1.1 Market Trends
10.2.1.2 Market Forecast
10.2.2 Japan
10.2.2.1 Market Trends
10.2.2.2 Market Forecast
10.2.3 India
10.2.3.1 Market Trends
10.2.3.2 Market Forecast
10.2.4 South Korea
10.2.4.1 Market Trends
10.2.4.2 Market Forecast
10.2.5 Australia
10.2.5.1 Market Trends
10.2.5.2 Market Forecast
10.2.6 Indonesia
10.2.6.1 Market Trends
10.2.6.2 Market Forecast
10.2.7 Others
10.2.7.1 Market Trends
10.2.7.2 Market Forecast
10.3 Europe
10.3.1 Germany
10.3.1.1 Market Trends
10.3.1.2 Market Forecast
10.3.2 France
10.3.2.1 Market Trends
10.3.2.2 Market Forecast
10.3.3 United Kingdom
10.3.3.1 Market Trends
10.3.3.2 Market Forecast
10.3.4 Italy
10.3.4.1 Market Trends
10.3.4.2 Market Forecast
10.3.5 Spain
10.3.5.1 Market Trends
10.3.5.2 Market Forecast
10.3.6 Russia
10.3.6.1 Market Trends
10.3.6.2 Market Forecast
10.3.7 Others
10.3.7.1 Market Trends
10.3.7.2 Market Forecast
10.4 Latin America
10.4.1 Brazil
10.4.1.1 Market Trends
10.4.1.2 Market Forecast
10.4.2 Mexico
10.4.2.1 Market Trends
10.4.2.2 Market Forecast
10.4.3 Others
10.4.3.1 Market Trends
10.4.3.2 Market Forecast
10.5 Middle East and Africa
10.5.1 Market Trends
10.5.2 Market Breakup by Country
10.5.3 Market Forecast
11 SWOT Analysis
11.1 Overview
11.2 Strengths
11.3 Weaknesses
11.4 Opportunities
11.5 Threats
12 Value Chain Analysis
13 Porters Five Forces Analysis
13.1 Overview
13.2 Bargaining Power of Buyers
13.3 Bargaining Power of Suppliers
13.4 Degree of Competition
13.5 Threat of New Entrants
13.6 Threat of Substitutes
14 Price Analysis
15 Competitive Landscape
15.1 Market Structure
15.2 Key Players
15.3 Profiles of Key Players
15.3.1 AB Holding S.p.a.
15.3.1.1 Company Overview
15.3.1.2 Product Portfolio
15.3.2 Agraferm GmbH
15.3.2.1 Company Overview
15.3.2.2 Product Portfolio
15.3.3 Air Liquide S.A.
15.3.3.1 Company Overview
15.3.3.2 Product Portfolio
15.3.3.3 Financials
15.3.3.4 SWOT Analysis
15.3.4 Ameresco Inc.
15.3.4.1 Company Overview
15.3.4.2 Product Portfolio
15.3.4.3 Financials
15.3.4.4 SWOT Analysis
15.3.5 BTS Biogas Srl/GmbH (Bioenergy Devco)
15.3.5.1 Company Overview
15.3.5.2 Product Portfolio
15.3.6 Engie SA
15.3.6.1 Company Overview
15.3.6.2 Product Portfolio
15.3.6.3 Financials
15.3.6.4 SWOT Analysis
15.3.7 EnviTec Biogas AG
15.3.7.1 Company Overview
15.3.7.2 Product Portfolio
15.3.7.3 Financials
15.3.7.4 SWOT Analysis
15.3.8 Finn Biogas
15.3.8.1 Company Overview
15.3.8.2 Product Portfolio
15.3.9 IES BIOGAS S.r.l. (Snam SPA)
15.3.9.1 Company Overview
15.3.9.2 Product Portfolio
15.3.10 NASKEO environnement
15.3.10.1 Company Overview
15.3.10.2 Product Portfolio
15.3.11 PlanET Biogas Group GmbH
15.3.11.1 Company Overview
15.3.11.2 Product Portfolio
15.3.12 Scandinavian Biogas Fuels International AB
15.3.12.1 Company Overview
15.3.12.2 Product Portfolio
15.3.12.3 Financials
15.3.13 Wärtsilä Oyj Abp
15.3.13.1 Company Overview
15.3.13.2 Product Portfolio
15.3.13.3 Financials
15.3.13.4 SWOT Analysis
List of Figures
Figure 1: Global: Biogas Plant Market: Major Drivers and Challenges
Figure 2: Global: Biogas Plant Market: Volume Trends (in GW), 2019-2024
Figure 3: Global: Biogas Plant Market Forecast: Volume Trends (in GW), 2025-2033
Figure 4: Global: Biogas Plant Market: Value Trends (in Billion USD), 2019-2024
Figure 5: Global: Biogas Plant Market Forecast: Value Trends (in Billion USD), 2025-2033
Figure 6: Global: Biogas Plant Market: Breakup by Biogas Plant Type (in %), 2024
Figure 7: Global: Biogas Plant Market: Breakup by Feedstock (in %), 2024
Figure 8: Global: Biogas Plant Market: Breakup by Digestor Type (in %), 2024
Figure 9: Global: Biogas Plant Market: Breakup by Application (in %), 2024
Figure 10: Global: Biogas Plant Market: Breakup by Region (in %), 2024
Figure 11: Global: Biogas Plant (Small-scale Digesters) Market: Sales Value (in Million USD), 2019 & 2024
Figure 12: Global: Biogas Plant (Small-scale Digesters) Market Forecast: Sales Value (in Million USD), 2025-2033
Figure 13: Global: Biogas Plant (Medium-to-Large-scale Digesters) Market: Sales Value (in Million USD), 2019 & 2024
Figure 14: Global: Biogas Plant (Medium-to-Large-scale Digesters) Market Forecast: Sales Value (in Million USD), 2025-2033
Figure 15: Global: Biogas Plant (Agricultural Waste) Market: Sales Value (in Million USD), 2019 & 2024
Figure 16: Global: Biogas Plant (Agricultural Waste) Market Forecast: Sales Value (in Million USD), 2025-2033
Figure 17: Global: Biogas Plant (Industrial Waste) Market: Sales Value (in Million USD), 2019 & 2024
Figure 18: Global: Biogas Plant (Industrial Waste) Market Forecast: Sales Value (in Million USD), 2025-2033
Figure 19: Global: Biogas Plant (Sewage Sludge) Market: Sales Value (in Million USD), 2019 & 2024
Figure 20: Global: Biogas Plant (Sewage Sludge) Market Forecast: Sales Value (in Million USD), 2025-2033
Figure 21: Global: Biogas Plant (Other Feedstocks) Market: Sales Value (in Million USD), 2019 & 2024
Figure 22: Global: Biogas Plant (Other Feedstocks) Market Forecast: Sales Value (in Million USD), 2025-2033
Figure 23: Global: Biogas Plant (Wet Anaerobic Digestion) Market: Sales Value (in Million USD), 2019 & 2024
Figure 24: Global: Biogas Plant (Wet Anaerobic Digestion) Market Forecast: Sales Value (in Million USD), 2025-2033
Figure 25: Global: Biogas Plant (Dry Anaerobic Digestion) Market: Sales Value (in Million USD), 2019 & 2024
Figure 26: Global: Biogas Plant (Dry Anaerobic Digestion) Market Forecast: Sales Value (in Million USD), 2025-2033
Figure 27: Global: Biogas Plant (Electricity Generation) Market: Sales Value (in Million USD), 2019 & 2024
Figure 28: Global: Biogas Plant (Electricity Generation) Market Forecast: Sales Value (in Million USD), 2025-2033
Figure 29: Global: Biogas Plant (Biofuel Generation) Market: Sales Value (in Million USD), 2019 & 2024
Figure 30: Global: Biogas Plant (Biofuel Generation) Market Forecast: Sales Value (in Million USD), 2025-2033
Figure 31: Global: Biogas Plant (Heat Generation) Market: Sales Value (in Million USD), 2019 & 2024
Figure 32: Global: Biogas Plant (Heat Generation) Market Forecast: Sales Value (in Million USD), 2025-2033
Figure 33: North America: Biogas Plant Market: Sales Value (in Million USD), 2019 & 2024
Figure 34: North America: Biogas Plant Market Forecast: Sales Value (in Million USD), 2025-2033
Figure 35: United States: Biogas Plant Market: Sales Value (in Million USD), 2019 & 2024
Figure 36: United States: Biogas Plant Market Forecast: Sales Value (in Million USD), 2025-2033
Figure 37: Canada: Biogas Plant Market: Sales Value (in Million USD), 2019 & 2024
Figure 38: Canada: Biogas Plant Market Forecast: Sales Value (in Million USD), 2025-2033
Figure 39: Asia-Pacific: Biogas Plant Market: Sales Value (in Million USD), 2019 & 2024
Figure 40: Asia-Pacific: Biogas Plant Market Forecast: Sales Value (in Million USD), 2025-2033
Figure 41: China: Biogas Plant Market: Sales Value (in Million USD), 2019 & 2024
Figure 42: China: Biogas Plant Market Forecast: Sales Value (in Million USD), 2025-2033
Figure 43: Japan: Biogas Plant Market: Sales Value (in Million USD), 2019 & 2024
Figure 44: Japan: Biogas Plant Market Forecast: Sales Value (in Million USD), 2025-2033
Figure 45: India: Biogas Plant Market: Sales Value (in Million USD), 2019 & 2024
Figure 46: India: Biogas Plant Market Forecast: Sales Value (in Million USD), 2025-2033
Figure 47: South Korea: Biogas Plant Market: Sales Value (in Million USD), 2019 & 2024
Figure 48: South Korea: Biogas Plant Market Forecast: Sales Value (in Million USD), 2025-2033
Figure 49: Australia: Biogas Plant Market: Sales Value (in Million USD), 2019 & 2024
Figure 50: Australia: Biogas Plant Market Forecast: Sales Value (in Million USD), 2025-2033
Figure 51: Indonesia: Biogas Plant Market: Sales Value (in Million USD), 2019 & 2024
Figure 52: Indonesia: Biogas Plant Market Forecast: Sales Value (in Million USD), 2025-2033
Figure 53: Others: Biogas Plant Market: Sales Value (in Million USD), 2019 & 2024
Figure 54: Others: Biogas Plant Market Forecast: Sales Value (in Million USD), 2025-2033
Figure 55: Europe: Biogas Plant Market: Sales Value (in Million USD), 2019 & 2024
Figure 56: Europe: Biogas Plant Market Forecast: Sales Value (in Million USD), 2025-2033
Figure 57: Germany: Biogas Plant Market: Sales Value (in Million USD), 2019 & 2024
Figure 58: Germany: Biogas Plant Market Forecast: Sales Value (in Million USD), 2025-2033
Figure 59: France: Biogas Plant Market: Sales Value (in Million USD), 2019 & 2024
Figure 60: France: Biogas Plant Market Forecast: Sales Value (in Million USD), 2025-2033
Figure 61: United Kingdom: Biogas Plant Market: Sales Value (in Million USD), 2019 & 2024
Figure 62: United Kingdom: Biogas Plant Market Forecast: Sales Value (in Million USD), 2025-2033
Figure 63: Italy: Biogas Plant Market: Sales Value (in Million USD), 2019 & 2024
Figure 64: Italy: Biogas Plant Market Forecast: Sales Value (in Million USD), 2025-2033
Figure 65: Spain: Biogas Plant Market: Sales Value (in Million USD), 2019 & 2024
Figure 66: Spain: Biogas Plant Market Forecast: Sales Value (in Million USD), 2025-2033
Figure 67: Russia: Biogas Plant Market: Sales Value (in Million USD), 2019 & 2024
Figure 68: Russia: Biogas Plant Market Forecast: Sales Value (in Million USD), 2025-2033
Figure 69: Others: Biogas Plant Market: Sales Value (in Million USD), 2019 & 2024
Figure 70: Others: Biogas Plant Market Forecast: Sales Value (in Million USD), 2025-2033
Figure 71: Latin America: Biogas Plant Market: Sales Value (in Million USD), 2019 & 2024
Figure 72: Latin America: Biogas Plant Market Forecast: Sales Value (in Million USD), 2025-2033
Figure 73: Brazil: Biogas Plant Market: Sales Value (in Million USD), 2019 & 2024
Figure 74: Brazil: Biogas Plant Market Forecast: Sales Value (in Million USD), 2025-2033
Figure 75: Mexico: Biogas Plant Market: Sales Value (in Million USD), 2019 & 2024
Figure 76: Mexico: Biogas Plant Market Forecast: Sales Value (in Million USD), 2025-2033
Figure 77: Others: Biogas Plant Market: Sales Value (in Million USD), 2019 & 2024
Figure 78: Others: Biogas Plant Market Forecast: Sales Value (in Million USD), 2025-2033
Figure 79: Middle East and Africa: Biogas Plant Market: Sales Value (in Million USD), 2019 & 2024
Figure 80: Middle East and Africa: Biogas Plant Market: Breakup by Country (in %), 2024
Figure 81: Middle East and Africa: Biogas Plant Market Forecast: Sales Value (in Million USD), 2025-2033
Figure 82: Global: Biogas Plant Industry: SWOT Analysis
Figure 83: Global: Biogas Plant Industry: Value Chain Analysis
Figure 84: Global: Biogas Plant Industry: Porter’s Five Forces Analysis
List of Tables
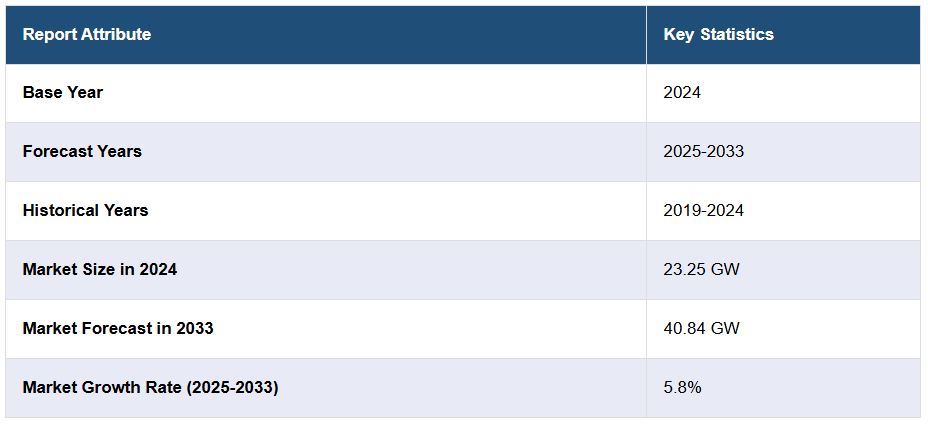
Table 1: Global: Biogas Plant Market: Key Industry Highlights, 2024 & 2033
Table 2: Global: Biogas Plant Market Forecast: Breakup by Biogas Plant Type (in Million USD), 2025-2033
Table 3: Global: Biogas Plant Market Forecast: Breakup by Feedstock (in Million USD), 2025-2033
Table 4: Global: Biogas Plant Market Forecast: Breakup by Digestor Type (in Million USD), 2025-2033
Table 5: Global: Biogas Plant Market Forecast: Breakup by Application (in Million USD), 2025-2033
Table 6: Global: Biogas Plant Market Forecast: Breakup by Region (in Million USD), 2025-2033
Table 7: Global: Biogas Plant Market: Competitive Structure
Table 8: Global: Biogas Plant Market: Key Players


