1 Executive Summary
- 1.1 Market overview
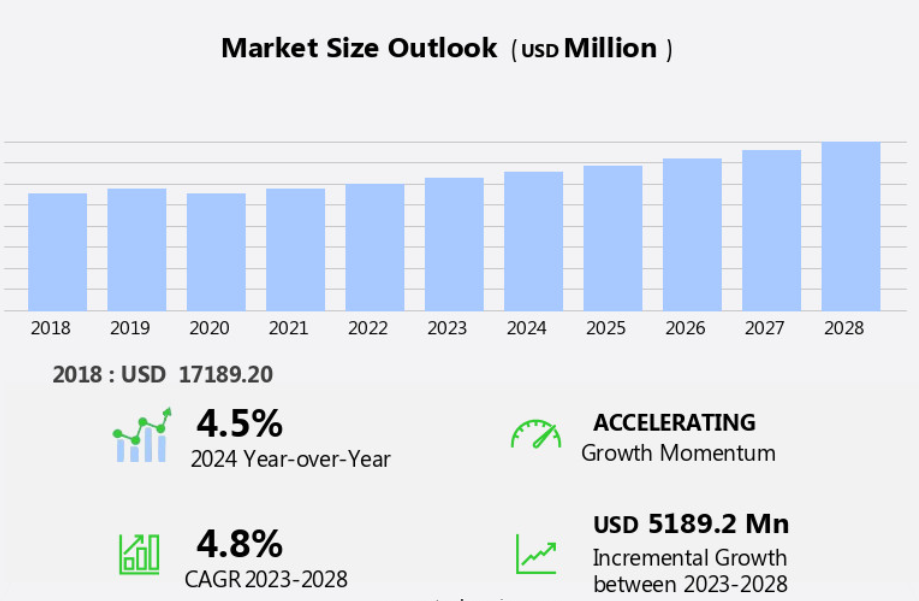
- Executive Summary – Chart on Market Overview
- Executive Summary – Data Table on Market Overview
- Executive Summary – Chart on Global Market Characteristics
- Executive Summary – Chart on Market by Geography
- Executive Summary – Chart on Market Segmentation by Product
- Executive Summary – Chart on Incremental Growth
- Executive Summary – Data Table on Incremental Growth
- Executive Summary – Chart on Company Market Positioning
2 Market Landscape
- 2.1 Market ecosystem
- Parent Market
- Data Table on – Parent Market
- 2.2 Market characteristics
- Market characteristics analysis
- 2.3 Value chain analysis
- Value Chain Analysis
3 Market Sizing
- 3.1 Market definition
- Offerings of companies included in the market definition
- 3.2 Market segment analysis
- Market segments
- 3.3 Market size 2023
- 3.4 Market outlook: Forecast for 2023-2028
- Chart on Global – Market size and forecast 2023-2028 ($ million)
- Data Table on Global – Market size and forecast 2023-2028 ($ million)
- Chart on Global Market: Year-over-year growth 2023-2028 (%)
- Data Table on Global Market: Year-over-year growth 2023-2028 (%)
4 Historic Market Size
- 4.1 Global Medical Foods Market 2018 – 2022
- Historic Market Size – Data Table on Global Medical Foods Market 2018 – 2022 ($ million)
- 4.2 Product segment analysis 2018 – 2022
- Historic Market Size – Product Segment 2018 – 2022 ($ million)
- 4.3 Geography segment analysis 2018 – 2022
- Historic Market Size – Geography Segment 2018 – 2022 ($ million)
- 4.4 Country segment analysis 2018 – 2022
- Historic Market Size – Country Segment 2018 – 2022 ($ million)
5 Five Forces Analysis
- 5.1 Five forces summary
- Five forces analysis – Comparison between 2023 and 2028
- 5.2 Bargaining power of buyers
- Bargaining power of buyers – Impact of key factors 2023 and 2028
- 5.3 Bargaining power of suppliers
- Bargaining power of suppliers – Impact of key factors in 2023 and 2028
- 5.4 Threat of new entrants
- Threat of new entrants – Impact of key factors in 2023 and 2028
- 5.5 Threat of substitutes
- Threat of substitutes – Impact of key factors in 2023 and 2028
- 5.6 Threat of rivalry
- Threat of rivalry – Impact of key factors in 2023 and 2028
- 5.7 Market condition
- Chart on Market condition – Five forces 2023 and 2028
6 Market Segmentation by Product
- 6.1 Market segments
- Chart on Product – Market share (2023-2028) (%)
- Data Table on Product – Market share (2023-2028) (%)
- 6.2 Comparison by Product
- Chart on Comparison by Product
- Data Table on Comparison by Product
- 6.3 Powder – Market size and forecast (2023-2028)
- Chart on Powder – Market size and forecast (2023-2028) ($ million)
- Data Table on Powder – Market size and forecast (2023-2028) ($ million)
- Chart on Powder – Year-over-year growth (2023-2028) (%)
- Data Table on Powder – Year-over-year growth (2023-2028) (%)
- 6.4 Pill – Market size and forecast (2023-2028)
- Chart on Pill – Market size and forecast (2023-2028) ($ million)
- Data Table on Pill – Market size and forecast (2023-2028) ($ million)
- Chart on Pill – Year-over-year growth (2023-2028) (%)
- Data Table on Pill – Year-over-year growth (2023-2028) (%)
- 6.5 Others – Market size and forecast (2023-2028)
- Chart on Others – Market size and forecast (2023-2028) ($ million)
- Data Table on Others – Market size and forecast (2023-2028) ($ million)
- Chart on Others – Year-over-year growth (2023-2028) (%)
- Data Table on Others – Year-over-year growth (2023-2028) (%)
- 6.6 Market opportunity by Product
- Market opportunity by Product ($ million)
- Data Table on Market opportunity by Product ($ million)
7 Market Segmentation by Type
- 7.1 Market segments
- Chart on Type – Market share (2023-2028) (%)
- Data Table on Type – Market share (2023-2028) (%)
- 7.2 Comparison by Type
- Chart on Comparison by Type
- Data Table on Comparison by Type
- 7.3 Oral Nutrition – Market size and forecast (2023-2028)
- Chart on Oral Nutrition – Market size and forecast (2023-2028) ($ million)
- Data Table on Oral Nutrition – Market size and forecast (2023-2028) ($ million)
- Chart on Oral Nutrition – Year-over-year growth (2023-2028) (%)
- Data Table on Oral Nutrition – Year-over-year growth (2023-2028) (%)
- 7.4 Enteral Nutrition – Market size and forecast (2023-2028)
- Chart on Enteral Nutrition – Market size and forecast (2023-2028) ($ million)
- Data Table on Enteral Nutrition – Market size and forecast (2023-2028) ($ million)
- Chart on Enteral Nutrition – Year-over-year growth (2023-2028) (%)
- Data Table on Enteral Nutrition – Year-over-year growth (2023-2028) (%)
- 7.5 Metabolic Disorder Formulas – Market size and forecast (2023-2028)
- Chart on Metabolic Disorder Formulas – Market size and forecast (2023-2028) ($ million)
- Data Table on Metabolic Disorder Formulas – Market size and forecast (2023-2028) ($ million)
- Chart on Metabolic Disorder Formulas – Year-over-year growth (2023-2028) (%)
- Data Table on Metabolic Disorder Formulas – Year-over-year growth (2023-2028) (%)
- 7.6 Market opportunity by Type
- Market opportunity by Type ($ million)
- Data Table on Market opportunity by Type ($ million)
8 Market Segmentation by Application
- 8.1 Market segments
- Chart on Application – Market share (2023-2028) (%)
- Data Table on Application – Market share (2023-2028) (%)
- 8.2 Comparison by Application
- Chart on Comparison by Application
- Data Table on Comparison by Application
- 8.3 Diabetes – Market size and forecast (2023-2028)
- Chart on Diabetes – Market size and forecast (2023-2028) ($ million)
- Data Table on Diabetes – Market size and forecast (2023-2028) ($ million)
- Chart on Diabetes – Year-over-year growth (2023-2028) (%)
- Data Table on Diabetes – Year-over-year growth (2023-2028) (%)
- 8.4 Cancer – Market size and forecast (2023-2028)
- Chart on Cancer – Market size and forecast (2023-2028) ($ million)
- Data Table on Cancer – Market size and forecast (2023-2028) ($ million)
- Chart on Cancer – Year-over-year growth (2023-2028) (%)
- Data Table on Cancer – Year-over-year growth (2023-2028) (%)
- 8.5 Neurological Disorders – Market size and forecast (2023-2028)
- Chart on Neurological Disorders – Market size and forecast (2023-2028) ($ million)
- Data Table on Neurological Disorders – Market size and forecast (2023-2028) ($ million)
- Chart on Neurological Disorders – Year-over-year growth (2023-2028) (%)
- Data Table on Neurological Disorders – Year-over-year growth (2023-2028) (%)
- 8.6 Inborn Errors of Metabolism – Market size and forecast (2023-2028)
- Chart on Inborn Errors of Metabolism – Market size and forecast (2023-2028) ($ million)
- Data Table on Inborn Errors of Metabolism – Market size and forecast (2023-2028) ($ million)
- Chart on Inborn Errors of Metabolism – Year-over-year growth (2023-2028) (%)
- Data Table on Inborn Errors of Metabolism – Year-over-year growth (2023-2028) (%)
- 8.7 Market opportunity by Application
- Market opportunity by Application ($ million)
- Data Table on Market opportunity by Application ($ million)
9 Market Segmentation by Distribution Channel
- 9.1 Market segments
- Chart on Distribution Channel – Market share (2023-2028) (%)
- Data Table on Distribution Channel – Market share (2023-2028) (%)
- 9.2 Comparison by Distribution Channel
- Chart on Comparison by Distribution Channel
- Data Table on Comparison by Distribution Channel
- 9.3 Pharmacies – Market size and forecast (2023-2028)
- Chart on Pharmacies – Market size and forecast (2023-2028) ($ million)
- Data Table on Pharmacies – Market size and forecast (2023-2028) ($ million)
- Chart on Pharmacies – Year-over-year growth (2023-2028) (%)
- Data Table on Pharmacies – Year-over-year growth (2023-2028) (%)
- 9.4 Hospitals & Clinics – Market size and forecast (2023-2028)
- Chart on Hospitals & Clinics – Market size and forecast (2023-2028) ($ million)
- Data Table on Hospitals & Clinics – Market size and forecast (2023-2028) ($ million)
- Chart on Hospitals & Clinics – Year-over-year growth (2023-2028) (%)
- Data Table on Hospitals & Clinics – Year-over-year growth (2023-2028) (%)
- 9.5 Online Retail – Market size and forecast (2023-2028)
- Chart on Online Retail – Market size and forecast (2023-2028) ($ million)
- Data Table on Online Retail – Market size and forecast (2023-2028) ($ million)
- Chart on Online Retail – Year-over-year growth (2023-2028) (%)
- Data Table on Online Retail – Year-over-year growth (2023-2028) (%)
- 9.6 Specialty Stores – Market size and forecast (2023-2028)
- Chart on Specialty Stores – Market size and forecast (2023-2028) ($ million)
- Data Table on Specialty Stores – Market size and forecast (2023-2028) ($ million)
- Chart on Specialty Stores – Year-over-year growth (2023-2028) (%)
- Data Table on Specialty Stores – Year-over-year growth (2023-2028) (%)
- 9.7 Market opportunity by Distribution Channel
- Market opportunity by Distribution Channel ($ million)
- Data Table on Market opportunity by Distribution Channel ($ million)
10 Customer Landscape
- 10.1 Customer landscape overview
- Analysis of price sensitivity, lifecycle, customer purchase basket, adoption rates, and purchase criteria
11 Geographic Landscape
- 11.1 Geographic segmentation
- Chart on Market share by geography 2023-2028 (%)
- Data Table on Market share by geography 2023-2028 (%)
- 11.2 Geographic comparison
- Chart on Geographic comparison
- Data Table on Geographic comparison
- 11.3 North America – Market size and forecast 2023-2028
- Chart on North America – Market size and forecast 2023-2028 ($ million)
- Data Table on North America – Market size and forecast 2023-2028 ($ million)
- Chart on North America – Year-over-year growth 2023-2028 (%)
- Data Table on North America – Year-over-year growth 2023-2028 (%)
- 11.4 Europe – Market size and forecast 2023-2028
- Chart on Europe – Market size and forecast 2023-2028 ($ million)
- Data Table on Europe – Market size and forecast 2023-2028 ($ million)
- Chart on Europe – Year-over-year growth 2023-2028 (%)
- Data Table on Europe – Year-over-year growth 2023-2028 (%)
- 11.5 APAC – Market size and forecast 2023-2028
- Chart on APAC – Market size and forecast 2023-2028 ($ million)
- Data Table on APAC – Market size and forecast 2023-2028 ($ million)
- Chart on APAC – Year-over-year growth 2023-2028 (%)
- Data Table on APAC – Year-over-year growth 2023-2028 (%)
- 11.6 South America – Market size and forecast 2023-2028
- Chart on South America – Market size and forecast 2023-2028 ($ million)
- Data Table on South America – Market size and forecast 2023-2028 ($ million)
- Chart on South America – Year-over-year growth 2023-2028 (%)
- Data Table on South America – Year-over-year growth 2023-2028 (%)
- 11.7 Middle East and Africa – Market size and forecast 2023-2028
- Chart on Middle East and Africa – Market size and forecast 2023-2028 ($ million)
- Data Table on Middle East and Africa – Market size and forecast 2023-2028 ($ million)
- Chart on Middle East and Africa – Year-over-year growth 2023-2028 (%)
- Data Table on Middle East and Africa – Year-over-year growth 2023-2028 (%)
- 11.8 US – Market size and forecast 2023-2028
- Chart on US – Market size and forecast 2023-2028 ($ million)
- Data Table on US – Market size and forecast 2023-2028 ($ million)
- Chart on US – Year-over-year growth 2023-2028 (%)
- Data Table on US – Year-over-year growth 2023-2028 (%)
- 11.9 China – Market size and forecast 2023-2028
- Chart on China – Market size and forecast 2023-2028 ($ million)
- Data Table on China – Market size and forecast 2023-2028 ($ million)
- Chart on China – Year-over-year growth 2023-2028 (%)
- Data Table on China – Year-over-year growth 2023-2028 (%)
- 11.10 Germany – Market size and forecast 2023-2028
- Chart on Germany – Market size and forecast 2023-2028 ($ million)
- Data Table on Germany – Market size and forecast 2023-2028 ($ million)
- Chart on Germany – Year-over-year growth 2023-2028 (%)
- Data Table on Germany – Year-over-year growth 2023-2028 (%)
- 11.11 France – Market size and forecast 2023-2028
- Chart on France – Market size and forecast 2023-2028 ($ million)
- Data Table on France – Market size and forecast 2023-2028 ($ million)
- Chart on France – Year-over-year growth 2023-2028 (%)
- Data Table on France – Year-over-year growth 2023-2028 (%)
- 11.12 UK – Market size and forecast 2023-2028
- Chart on UK – Market size and forecast 2023-2028 ($ million)
- Data Table on UK – Market size and forecast 2023-2028 ($ million)
- Chart on UK – Year-over-year growth 2023-2028 (%)
- Data Table on UK – Year-over-year growth 2023-2028 (%)
- 11.13 Market opportunity by geography
- Market opportunity by geography ($ million)
- Data Tables on Market opportunity by geography ($ million)
- 11.14 US – Market size and forecast (2023-2028)
- Chart on US – Market size and forecast (2023-2028) ($ million)
- Data Table on US – Market size and forecast (2023-2028) ($ million)
- Chart on US – Year-over-year growth (2023-2028) (%)
- Data Table on US – Year-over-year growth (2023-2028) (%)
- 11.15 Canada – Market size and forecast (2023-2028)
- Chart on Canada – Market size and forecast (2023-2028) ($ million)
- Data Table on Canada – Market size and forecast (2023-2028) ($ million)
- Chart on Canada – Year-over-year growth (2023-2028) (%)
- Data Table on Canada – Year-over-year growth (2023-2028) (%)
- 11.16 Italy – Market size and forecast (2023-2028)
- Chart on Italy – Market size and forecast (2023-2028) ($ million)
- Data Table on Italy – Market size and forecast (2023-2028) ($ million)
- Chart on Italy – Year-over-year growth (2023-2028) (%)
- Data Table on Italy – Year-over-year growth (2023-2028) (%)
- 11.17 India – Market size and forecast (2023-2028)
- Chart on India – Market size and forecast (2023-2028) ($ million)
- Data Table on India – Market size and forecast (2023-2028) ($ million)
- Chart on India – Year-over-year growth (2023-2028) (%)
- Data Table on India – Year-over-year growth (2023-2028) (%)
- 11.18 Japan – Market size and forecast (2023-2028)
- Chart on Japan – Market size and forecast (2023-2028) ($ million)
- Data Table on Japan – Market size and forecast (2023-2028) ($ million)
- Chart on Japan – Year-over-year growth (2023-2028) (%)
- Data Table on Japan – Year-over-year growth (2023-2028) (%)
- 11.19 Brazil – Market size and forecast (2023-2028)
- Chart on Brazil – Market size and forecast (2023-2028) ($ million)
- Data Table on Brazil – Market size and forecast (2023-2028) ($ million)
- Chart on Brazil – Year-over-year growth (2023-2028) (%)
- Data Table on Brazil – Year-over-year growth (2023-2028) (%)
- 11.20 Egypt – Market size and forecast (2023-2028)
- Chart on Egypt – Market size and forecast (2023-2028) ($ million)
- Data Table on Egypt – Market size and forecast (2023-2028) ($ million)
- Chart on Egypt – Year-over-year growth (2023-2028) (%)
- Data Table on Egypt – Year-over-year growth (2023-2028) (%)
- 11.21 UAE – Market size and forecast (2023-2028)
- Chart on UAE – Market size and forecast (2023-2028) ($ million)
- Data Table on UAE – Market size and forecast (2023-2028) ($ million)
- Chart on UAE – Year-over-year growth (2023-2028) (%)
- Data Table on UAE – Year-over-year growth (2023-2028) (%)
- 11.22 Oman – Market size and forecast (2023-2028)
- Chart on Oman – Market size and forecast (2023-2028) ($ million)
- Data Table on Oman – Market size and forecast (2023-2028) ($ million)
- Chart on Oman – Year-over-year growth (2023-2028) (%)
- Data Table on Oman – Year-over-year growth (2023-2028) (%)
- 11.23 Argentina – Market size and forecast (2023-2028)
- Chart on Argentina – Market size and forecast (2023-2028) ($ million)
- Data Table on Argentina – Market size and forecast (2023-2028) ($ million)
- Chart on Argentina – Year-over-year growth (2023-2028) (%)
- Data Table on Argentina – Year-over-year growth (2023-2028) (%)
- 11.24 KSA – Market size and forecast (2023-2028)
- Chart on KSA – Market size and forecast (2023-2028) ($ million)
- Data Table on KSA – Market size and forecast (2023-2028) ($ million)
- Chart on KSA – Year-over-year growth (2023-2028) (%)
- Data Table on KSA – Year-over-year growth (2023-2028) (%)
- 11.25 Rest of World (ROW) – Market size and forecast (2023-2028)
- Chart on Rest of World (ROW) – Market size and forecast (2023-2028) ($ million)
- Data Table on Rest of World (ROW) – Market size and forecast (2023-2028) ($ million)
- Chart on Rest of World (ROW) – Year-over-year growth (2023-2028) (%)
- Data Table on Rest of World (ROW) – Year-over-year growth (2023-2028) (%)
12 Drivers, Challenges, and Opportunity/Restraints
- 12.1 Market drivers
- 12.2 Market challenges
- 12.3 Impact of drivers and challenges
- Impact of drivers and challenges in 2023 and 2028
- 12.4 Market opportunities/restraints
13 Competitive Landscape
- 13.1 Overview
- 13.2 Competitive Landscape
- Overview on criticality of inputs and factors of differentiation
- 13.3 Landscape disruption
- Overview on factors of disruption
- 13.4 Industry risks
- Impact of key risks on business
14 Competitive Analysis
- 14.1 Companies profiled
- Companies covered
- 14.2 Market positioning of companies
- Matrix on companies position and classification
- 14.3 Abbott Laboratories
- Abbott Laboratories – Overview
- Abbott Laboratories – Business segments
- Abbott Laboratories – Key news
- Abbott Laboratories – Key offerings
- Abbott Laboratories – Segment focus
- 14.4 Danone SA
- Danone SA – Overview
- Danone SA – Business segments
- Danone SA – Key news
- Danone SA – Key offerings
- Danone SA – Segment focus
- 14.5 Fresenius Kabi AG
- Fresenius Kabi AG – Overview
- Fresenius Kabi AG – Product / Service
- Fresenius Kabi AG – Key offerings
- 14.6 Medtrition Inc.
- Medtrition Inc. – Overview
- Medtrition Inc. – Product / Service
- Medtrition Inc. – Key offerings
- 14.7 Metagenics LLC
- Metagenics LLC – Overview
- Metagenics LLC – Product / Service
- Metagenics LLC – Key offerings
- 14.8 Nestle SA
- Nestle SA – Overview
- Nestle SA – Business segments
- Nestle SA – Key news
- Nestle SA – Key offerings
- Nestle SA – Segment focus
- 14.9 Primus Pharmaceuticals Inc.
- Primus Pharmaceuticals Inc. – Overview
- Primus Pharmaceuticals Inc. – Product / Service
- Primus Pharmaceuticals Inc. – Key offerings
- 14.10 Proliant Inc.
- Proliant Inc. – Overview
- Proliant Inc. – Product / Service
- Proliant Inc. – Key offerings
- 14.11 Reckitt Benckiser Group Plc
- Reckitt Benckiser Group Plc – Overview
- Reckitt Benckiser Group Plc – Business segments
- Reckitt Benckiser Group Plc – Key news
- Reckitt Benckiser Group Plc – Key offerings
- Reckitt Benckiser Group Plc – Segment focus
- 14.12 Targeted Medical Pharma Inc.
- Targeted Medical Pharma Inc. – Overview
- Targeted Medical Pharma Inc. – Product / Service
- Targeted Medical Pharma Inc. – Key offerings
15 Appendix
- 15.1 Scope of the report
- 15.2 Inclusions and exclusions checklist
- Inclusions checklist
- Exclusions checklist
- 15.3 Currency conversion rates for US$
- Currency conversion rates for US$
- 15.4 Research methodology
- Research methodology
- 15.5 Data procurement
- Information sources
- 15.6 Data validation
- Data validation
- 15.7 Validation techniques employed for market sizing
- Validation techniques employed for market sizing
- 15.8 Data synthesis
- Data synthesis
- 15.9 360 degree market analysis
- 360 degree market analysis
- 15.10 List of abbreviations
- List of abbreviations


