1 Executive Summary
2 Preface
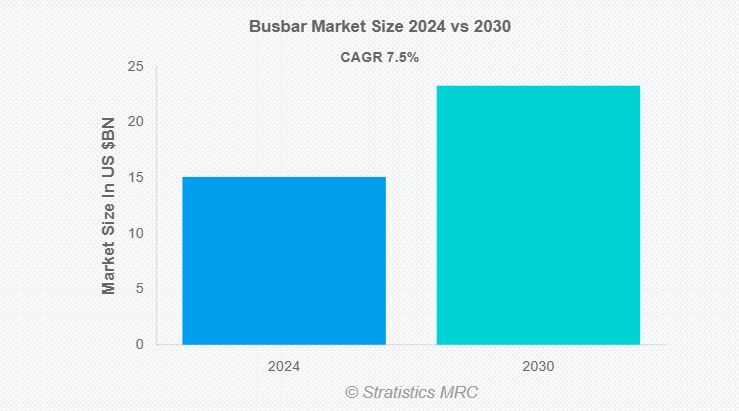
2.1 Abstract
2.2 Stake Holders
2.3 Research Scope
2.4 Research Methodology
2.4.1 Data Mining
2.4.2 Data Analysis
2.4.3 Data Validation
2.4.4 Research Approach
2.5 Research Sources
2.5.1 Primary Research Sources
2.5.2 Secondary Research Sources
2.5.3 Assumptions
3 Market Trend Analysis
3.1 Introduction
3.2 Drivers
3.3 Restraints
3.4 Opportunities
3.5 Threats
3.6 Application Analysis
3.7 End User Analysis
3.8 Emerging Markets
3.9 Impact of Covid-19
4 Porters Five Force Analysis
4.1 Bargaining power of suppliers
4.2 Bargaining power of buyers
4.3 Threat of substitutes
4.4 Threat of new entrants
4.5 Competitive rivalry
5 Global Busbar Market, By Conductor Material
5.1 Introduction
5.2 Copper
5.3 Aluminum
6 Global Busbar Market, By Power Rating
6.1 Introduction
6.2 Low Power
6.3 Medium Power
6.4 High Power
7 Global Busbar Market, By Application
7.1 Introduction
7.2 Power Distribution
7.3 Motor Control Centers
7.4 Renewable Energy
7.5 Data Centers
7.6 Transportation
7.7 Other Applications
8 Global Busbar Market, By End User
8.1 Introduction
8.2 Utilities
8.3 Industrial
8.4 Commercial
8.5 Residential
8.6 Other End Users
9 Global Busbar Market, By Geography
9.1 Introduction
9.2 North America
9.2.1 US
9.2.2 Canada
9.2.3 Mexico
9.3 Europe
9.3.1 Germany
9.3.2 UK
9.3.3 Italy
9.3.4 France
9.3.5 Spain
9.3.6 Rest of Europe
9.4 Asia Pacific
9.4.1 Japan
9.4.2 China
9.4.3 India
9.4.4 Australia
9.4.5 New Zealand
9.4.6 South Korea
9.4.7 Rest of Asia Pacific
9.5 South America
9.5.1 Argentina
9.5.2 Brazil
9.5.3 Chile
9.5.4 Rest of South America
9.6 Middle East & Africa
9.6.1 Saudi Arabia
9.6.2 UAE
9.6.3 Qatar
9.6.4 South Africa
9.6.5 Rest of Middle East & Africa
10 Key Developments
10.1 Agreements, Partnerships, Collaborations and Joint Ventures
10.2 Acquisitions & Mergers
10.3 New Product Launch
10.4 Expansions
10.5 Other Key Strategies
11 Company Profiling
11.1 TE Connectivity
11.2 Schneider Electric Co
11.3 Rittal GMBH & Co. KG
11.4 R.J. Group
11.5 Promet AG
11.6 Megabarre Group
11.7 Legrand
11.8 Larsen & Toubro
11.9 KGS Engineering Ltd
11.10 Godrej & Boyce Manufacturing Company Ltd.
11.11 General Electric Company
11.12 Entraco Power
11.13 Eaton Corporation, P.L.C.
11.14 C&S Electric Ltd.
11.15 Busbar Services
11.16 ABB Ltd.
11.17 A.E EleKTrik A.S.
List of Tables
1 Global Busbar Market Outlook, By Region (2022-2030) ($MN)
2 Global Busbar Market Outlook, By Conductor Material (2022-2030) ($MN)
3 Global Busbar Market Outlook, By Copper (2022-2030) ($MN)
4 Global Busbar Market Outlook, By Aluminum (2022-2030) ($MN)
5 Global Busbar Market Outlook, By Power Rating (2022-2030) ($MN)
6 Global Busbar Market Outlook, By Low Power (2022-2030) ($MN)
7 Global Busbar Market Outlook, By Medium Power (2022-2030) ($MN)
8 Global Busbar Market Outlook, By High Power (2022-2030) ($MN)
9 Global Busbar Market Outlook, By Application (2022-2030) ($MN)
10 Global Busbar Market Outlook, By Power Distribution (2022-2030) ($MN)
11 Global Busbar Market Outlook, By Motor Control Centers (2022-2030) ($MN)
12 Global Busbar Market Outlook, By Renewable Energy (2022-2030) ($MN)
13 Global Busbar Market Outlook, By Data Centers (2022-2030) ($MN)
14 Global Busbar Market Outlook, By Transportation (2022-2030) ($MN)
15 Global Busbar Market Outlook, By Other Applications (2022-2030) ($MN)
16 Global Busbar Market Outlook, By End User (2022-2030) ($MN)
17 Global Busbar Market Outlook, By Utilities (2022-2030) ($MN)
18 Global Busbar Market Outlook, By Industrial (2022-2030) ($MN)
19 Global Busbar Market Outlook, By Commercial (2022-2030) ($MN)
20 Global Busbar Market Outlook, By Residential (2022-2030) ($MN)
21 Global Busbar Market Outlook, By Other End Users (2022-2030) ($MN)
22 North America Busbar Market Outlook, By Country (2022-2030) ($MN)
23 North America Busbar Market Outlook, By Conductor Material (2022-2030) ($MN)
24 North America Busbar Market Outlook, By Copper (2022-2030) ($MN)
25 North America Busbar Market Outlook, By Aluminum (2022-2030) ($MN)
26 North America Busbar Market Outlook, By Power Rating (2022-2030) ($MN)
27 North America Busbar Market Outlook, By Low Power (2022-2030) ($MN)
28 North America Busbar Market Outlook, By Medium Power (2022-2030) ($MN)
29 North America Busbar Market Outlook, By High Power (2022-2030) ($MN)
30 North America Busbar Market Outlook, By Application (2022-2030) ($MN)
31 North America Busbar Market Outlook, By Power Distribution (2022-2030) ($MN)
32 North America Busbar Market Outlook, By Motor Control Centers (2022-2030) ($MN)
33 North America Busbar Market Outlook, By Renewable Energy (2022-2030) ($MN)
34 North America Busbar Market Outlook, By Data Centers (2022-2030) ($MN)
35 North America Busbar Market Outlook, By Transportation (2022-2030) ($MN)
36 North America Busbar Market Outlook, By Other Applications (2022-2030) ($MN)
37 North America Busbar Market Outlook, By End User (2022-2030) ($MN)
38 North America Busbar Market Outlook, By Utilities (2022-2030) ($MN)
39 North America Busbar Market Outlook, By Industrial (2022-2030) ($MN)
40 North America Busbar Market Outlook, By Commercial (2022-2030) ($MN)
41 North America Busbar Market Outlook, By Residential (2022-2030) ($MN)
42 North America Busbar Market Outlook, By Other End Users (2022-2030) ($MN)
43 Europe Busbar Market Outlook, By Country (2022-2030) ($MN)
44 Europe Busbar Market Outlook, By Conductor Material (2022-2030) ($MN)
45 Europe Busbar Market Outlook, By Copper (2022-2030) ($MN)
46 Europe Busbar Market Outlook, By Aluminum (2022-2030) ($MN)
47 Europe Busbar Market Outlook, By Power Rating (2022-2030) ($MN)
48 Europe Busbar Market Outlook, By Low Power (2022-2030) ($MN)
49 Europe Busbar Market Outlook, By Medium Power (2022-2030) ($MN)
50 Europe Busbar Market Outlook, By High Power (2022-2030) ($MN)
51 Europe Busbar Market Outlook, By Application (2022-2030) ($MN)
52 Europe Busbar Market Outlook, By Power Distribution (2022-2030) ($MN)
53 Europe Busbar Market Outlook, By Motor Control Centers (2022-2030) ($MN)
54 Europe Busbar Market Outlook, By Renewable Energy (2022-2030) ($MN)
55 Europe Busbar Market Outlook, By Data Centers (2022-2030) ($MN)
56 Europe Busbar Market Outlook, By Transportation (2022-2030) ($MN)
57 Europe Busbar Market Outlook, By Other Applications (2022-2030) ($MN)
58 Europe Busbar Market Outlook, By End User (2022-2030) ($MN)
59 Europe Busbar Market Outlook, By Utilities (2022-2030) ($MN)
60 Europe Busbar Market Outlook, By Industrial (2022-2030) ($MN)
61 Europe Busbar Market Outlook, By Commercial (2022-2030) ($MN)
62 Europe Busbar Market Outlook, By Residential (2022-2030) ($MN)
63 Europe Busbar Market Outlook, By Other End Users (2022-2030) ($MN)
64 Asia Pacific Busbar Market Outlook, By Country (2022-2030) ($MN)
65 Asia Pacific Busbar Market Outlook, By Conductor Material (2022-2030) ($MN)
66 Asia Pacific Busbar Market Outlook, By Copper (2022-2030) ($MN)
67 Asia Pacific Busbar Market Outlook, By Aluminum (2022-2030) ($MN)
68 Asia Pacific Busbar Market Outlook, By Power Rating (2022-2030) ($MN)
69 Asia Pacific Busbar Market Outlook, By Low Power (2022-2030) ($MN)
70 Asia Pacific Busbar Market Outlook, By Medium Power (2022-2030) ($MN)
71 Asia Pacific Busbar Market Outlook, By High Power (2022-2030) ($MN)
72 Asia Pacific Busbar Market Outlook, By Application (2022-2030) ($MN)
73 Asia Pacific Busbar Market Outlook, By Power Distribution (2022-2030) ($MN)
74 Asia Pacific Busbar Market Outlook, By Motor Control Centers (2022-2030) ($MN)
75 Asia Pacific Busbar Market Outlook, By Renewable Energy (2022-2030) ($MN)
76 Asia Pacific Busbar Market Outlook, By Data Centers (2022-2030) ($MN)
77 Asia Pacific Busbar Market Outlook, By Transportation (2022-2030) ($MN)
78 Asia Pacific Busbar Market Outlook, By Other Applications (2022-2030) ($MN)
79 Asia Pacific Busbar Market Outlook, By End User (2022-2030) ($MN)
80 Asia Pacific Busbar Market Outlook, By Utilities (2022-2030) ($MN)
81 Asia Pacific Busbar Market Outlook, By Industrial (2022-2030) ($MN)
82 Asia Pacific Busbar Market Outlook, By Commercial (2022-2030) ($MN)
83 Asia Pacific Busbar Market Outlook, By Residential (2022-2030) ($MN)
84 Asia Pacific Busbar Market Outlook, By Other End Users (2022-2030) ($MN)
85 South America Busbar Market Outlook, By Country (2022-2030) ($MN)
86 South America Busbar Market Outlook, By Conductor Material (2022-2030) ($MN)
87 South America Busbar Market Outlook, By Copper (2022-2030) ($MN)
88 South America Busbar Market Outlook, By Aluminum (2022-2030) ($MN)
89 South America Busbar Market Outlook, By Power Rating (2022-2030) ($MN)
90 South America Busbar Market Outlook, By Low Power (2022-2030) ($MN)
91 South America Busbar Market Outlook, By Medium Power (2022-2030) ($MN)
92 South America Busbar Market Outlook, By High Power (2022-2030) ($MN)
93 South America Busbar Market Outlook, By Application (2022-2030) ($MN)
94 South America Busbar Market Outlook, By Power Distribution (2022-2030) ($MN)
95 South America Busbar Market Outlook, By Motor Control Centers (2022-2030) ($MN)
96 South America Busbar Market Outlook, By Renewable Energy (2022-2030) ($MN)
97 South America Busbar Market Outlook, By Data Centers (2022-2030) ($MN)
98 South America Busbar Market Outlook, By Transportation (2022-2030) ($MN)
99 South America Busbar Market Outlook, By Other Applications (2022-2030) ($MN)
100 South America Busbar Market Outlook, By End User (2022-2030) ($MN)
101 South America Busbar Market Outlook, By Utilities (2022-2030) ($MN)
102 South America Busbar Market Outlook, By Industrial (2022-2030) ($MN)
103 South America Busbar Market Outlook, By Commercial (2022-2030) ($MN)
104 South America Busbar Market Outlook, By Residential (2022-2030) ($MN)
105 South America Busbar Market Outlook, By Other End Users (2022-2030) ($MN)
106 Middle East & Africa Busbar Market Outlook, By Country (2022-2030) ($MN)
107 Middle East & Africa Busbar Market Outlook, By Conductor Material (2022-2030) ($MN)
108 Middle East & Africa Busbar Market Outlook, By Copper (2022-2030) ($MN)
109 Middle East & Africa Busbar Market Outlook, By Aluminum (2022-2030) ($MN)
110 Middle East & Africa Busbar Market Outlook, By Power Rating (2022-2030) ($MN)
111 Middle East & Africa Busbar Market Outlook, By Low Power (2022-2030) ($MN)
112 Middle East & Africa Busbar Market Outlook, By Medium Power (2022-2030) ($MN)
113 Middle East & Africa Busbar Market Outlook, By High Power (2022-2030) ($MN)
114 Middle East & Africa Busbar Market Outlook, By Application (2022-2030) ($MN)
115 Middle East & Africa Busbar Market Outlook, By Power Distribution (2022-2030) ($MN)
116 Middle East & Africa Busbar Market Outlook, By Motor Control Centers (2022-2030) ($MN)
117 Middle East & Africa Busbar Market Outlook, By Renewable Energy (2022-2030) ($MN)
118 Middle East & Africa Busbar Market Outlook, By Data Centers (2022-2030) ($MN)
119 Middle East & Africa Busbar Market Outlook, By Transportation (2022-2030) ($MN)
120 Middle East & Africa Busbar Market Outlook, By Other Applications (2022-2030) ($MN)
121 Middle East & Africa Busbar Market Outlook, By End User (2022-2030) ($MN)
122 Middle East & Africa Busbar Market Outlook, By Utilities (2022-2030) ($MN)
123 Middle East & Africa Busbar Market Outlook, By Industrial (2022-2030) ($MN)
124 Middle East & Africa Busbar Market Outlook, By Commercial (2022-2030) ($MN)
125 Middle East & Africa Busbar Market Outlook, By Residential (2022-2030) ($MN)
126 Middle East & Africa Busbar Market Outlook, By Other End Users (2022-2030) ($MN)


