-
Methodology and Scope
- Research Methodology
- Research Objective and Scope of the Report
-
Market Definition and Overview
-
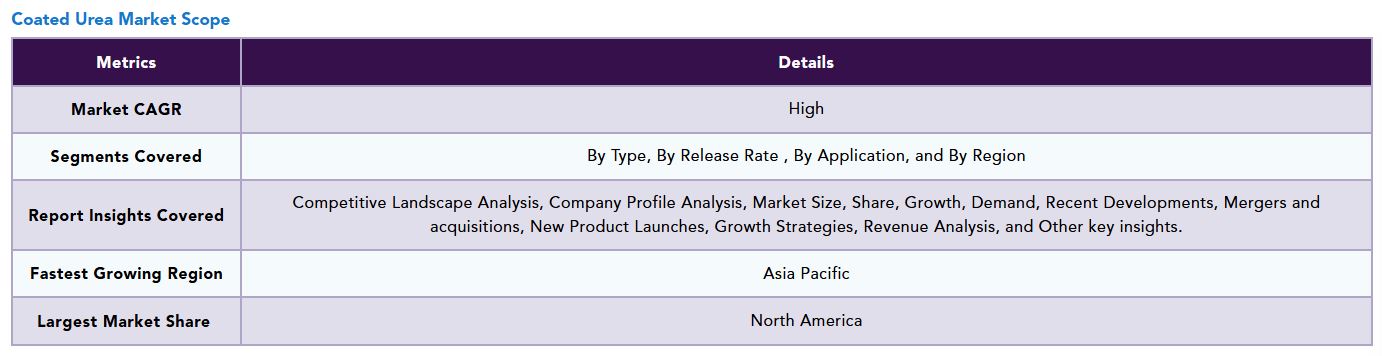
Executive Summary
- Market Snippet by Type
- Market Snippet by Release Rate
- Market Snippet by Application
- Market Snippet by Region
-
Market Dynamics
- Market Impacting Factors
- Drivers
- Restraints
- Impact Analysis
- Opportunity
- Market Impacting Factors
-
Industry Analysis
- Porter’s Five Forces Analysis
- Supply Chain Analysis
- Pricing Analysis
- Regulatory Analysis
-
By Type
- Introduction
- Market Size Analysis, and Y-o-Y Growth Analysis (%), By Type
- Market Attractiveness Index, By Type
- Polymer Coated Urea*
- Introduction
- Market Size Analysis, USD Mn, 2019-2028 and Y-o-Y Growth Analysis (%), 2021-2028
- Sulphur Coated Urea
- Others
- Introduction
-
By Release Rate
- Introduction
- Market Size Analysis, and Y-o-Y Growth Analysis (%), By Release Rate
- Market Attractiveness Index, By Release Rate
- Slow-Release*
- Introduction
- Market Size Analysis, US$ Mn, 2019-2028 and Y-o-Y Growth Analysis (%), 2021-2028
- Controlled-Release
- Stabilized-Release
- Introduction
-
By Application
- Introduction
- Market Size Analysis, and Y-o-Y Growth Analysis (%), By Application
- Market Attractiveness Index, By Application
- Agriculture Crops*
- Introduction
- Market Size Analysis, US$ Mn, 2019-2028 and Y-o-Y Growth Analysis (%), 2021-2028
- Lawn & Landscape Maintenance
- Nurseries
- Others
- Introduction
-
– By Region
- Introduction
- Market Size Analysis, and Y-o-Y Growth Analysis (%), By Region
- Market Attractiveness Index, By Region
- North America
- Introduction
- Key Region-Specific Dynamics
- Market Size Analysis, and Y-o-Y Growth Analysis (%), By Type
- Market Size Analysis, and Y-o-Y Growth Analysis (%), By Release Rate
- Market Size Analysis, and Y-o-Y Growth Analysis (%), By Application
- Market Size Analysis, and Y-o-Y Growth Analysis (%), By Country
- U.S.
- Canada
- Mexico
- Europe
- Introduction
- Key Region-Specific Dynamics
- Market Size Analysis, and Y-o-Y Growth Analysis (%), By Type
- Market Size Analysis, and Y-o-Y Growth Analysis (%), By Release Rate
- Market Size Analysis, and Y-o-Y Growth Analysis (%), By Country
- Germany
- U.K.
- Spain
- France
- Rest of Europe
- South America
- Introduction
- Key Region-Specific Dynamics
- Market Size Analysis, and Y-o-Y Growth Analysis (%), By Type
- Market Size Analysis, and Y-o-Y Growth Analysis (%), By Release Rate
- Market Size Analysis, and Y-o-Y Growth Analysis (%), By Country
- Brazil
- Argentina
- Rest of South America
- Asia Pacific
- Introduction
- Key Region-Specific Dynamics
- Market Size Analysis, and Y-o-Y Growth Analysis (%), By Type
- Market Size Analysis, and Y-o-Y Growth Analysis (%), By Release Rate
- Market Size Analysis, and Y-o-Y Growth Analysis (%), By Country
- China
- India
- Japan
- Australia
- Rest of Asia Pacific
- The Middle East and Africa
- Introduction
- Key Region-Specific Dynamics
- Market Size Analysis, and Y-o-Y Growth Analysis (%), By Type
- Market Size Analysis, and Y-o-Y Growth Analysis (%), By Release Rate
- Introduction
-
Competitive Landscape
- Competitive Scenario
- Market Positioning/Share Analysis
- Mergers and Acquisitions Analysis
- Market Entry Strategy
-
Company Profiles
- Hanfeng Evergreen*
- Company Overview
- Product Portfolio and Description
- Key Highlights
- Financial Overview
- Everris
- Turf Care Supply Corp.
- Abu Dhabi Fertilizer Industries Company
- Fertco Fertilisers
- The Andersons
- Yara Fertilisers India Pvt. Ltd.
- Spic
- VitalAgriNutrients
- Coromandel International Limited (List is not exhaustive)
- Hanfeng Evergreen*
-
Premium Insights
-
DataM Intelligence
- Appendix
- About Us and Services
- Contact Us
List of Tables
Table 01 Global Coated Urea Market Value, By Type, 2023, 2027 & 2031 ($ Million)
Table 02 Global Coated Urea Market Value, By Release Rate, 2023, 2027 & 2031 ($ Million)
Table 03 Global Coated Urea Market Value, By Application, 2023, 2027 & 2031 ($ Million)
Table 04 Global Coated Urea Market Value, By Region, 2023, 2027 & 2031 ($ Million)
Table 05 Global Coated Urea Market Value, By Type, 2023, 2027 & 2031 ($ Million)
Table 06 Global Coated Urea Market Value, By Type, 2022-2031 ($ Million)
Table 07 Global Coated Urea Market Value, By Release Rate, 2023, 2027 & 2031 ($ Million)
Table 08 Global Coated Urea Market Value, By Release Rate, 2022-2031 ($ Million)
Table 09 Global Coated Urea Market Value, By Application, 2023, 2027 & 2031 ($ Million)
Table 10 Global Coated Urea Market Value, By Application, 2022-2031 ($ Million)
Table 11 Global Coated Urea Market Value, By Region, 2023, 2027 & 2031 ($ Million)
Table 12 Global Coated Urea Market Value, By Region, 2022-2031 ($ Million)
Table 13 North America Coated Urea Market Value, By Type, 2022-2031 ($ Million)
Table 14 North America Coated Urea Market Value, By Release Rate, 2022-2031 ($ Million)
Table 15 North America Coated Urea Market Value, By Application, 2022-2031 ($ Million)
Table 16 North America Coated Urea Market Value, By Country, 2022-2031 ($ Million)
Table 17 South America Coated Urea Market Value, By Type, 2022-2031 ($ Million)
Table 18 South America Coated Urea Market Value, By Release Rate, 2022-2031 ($ Million)
Table 19 South America Coated Urea Market Value, By Application, 2022-2031 ($ Million)
Table 20 South America Coated Urea Market Value, By Country, 2022-2031 ($ Million)
Table 21 Europe Coated Urea Market Value, By Type, 2022-2031 ($ Million)
Table 22 Europe Coated Urea Market Value, By Release Rate, 2022-2031 ($ Million)
Table 23 Europe Coated Urea Market Value, By Application, 2022-2031 ($ Million)
Table 24 Europe Coated Urea Market Value, By Country, 2022-2031 ($ Million)
Table 25 Asia-Pacific Coated Urea Market Value, By Type, 2022-2031 ($ Million)
Table 26 Asia-Pacific Coated Urea Market Value, By Release Rate, 2022-2031 ($ Million)
Table 27 Asia-Pacific Coated Urea Market Value, By Application, 2022-2031 ($ Million)
Table 28 Asia-Pacific Coated Urea Market Value, By Country, 2022-2031 ($ Million)
Table 29 Middle East & Africa Coated Urea Market Value, By Type, 2022-2031 ($ Million)
Table 30 Middle East & Africa Coated Urea Market Value, By Release Rate, 2022-2031 ($ Million)
Table 31 Middle East & Africa Coated Urea Market Value, By Application, 2022-2031 ($ Million)
Table 32 Hanfeng Evergreen: Overview
Table 33 Hanfeng Evergreen: Product Portfolio
Table 34 Hanfeng Evergreen: Key Developments
Table 35 Everris: Overview
Table 36 Everris: Product Portfolio
Table 37 Everris: Key Developments
Table 38 Turf Care Supply Corp.: Overview
Table 39 Turf Care Supply Corp.: Product Portfolio
Table 40 Turf Care Supply Corp.: Key Developments
Table 41 Abu Dhabi Fertilizer Industries Company: Overview
Table 42 Abu Dhabi Fertilizer Industries Company: Product Portfolio
Table 43 Abu Dhabi Fertilizer Industries Company: Key Developments
Table 44 Fertco Fertilisers: Overview
Table 45 Fertco Fertilisers: Product Portfolio
Table 46 Fertco Fertilisers: Key Developments
Table 47 The Andersons: Overview
Table 48 The Andersons: Product Portfolio
Table 49 The Andersons: Key Developments
Table 50 Yara Fertilisers India Pvt. Ltd.: Overview
Table 51 Yara Fertilisers India Pvt. Ltd.: Product Portfolio
Table 52 Yara Fertilisers India Pvt. Ltd.: Key Developments
Table 53 Spic: Overview
Table 54 Spic: Product Portfolio
Table 55 Spic: Key Developments
Table 56 VitalAgriNutrients: Overview
Table 57 VitalAgriNutrients: Product Portfolio
Table 58 VitalAgriNutrients: Key Developments
List of Figures
Figure 01 Global Coated Urea Market Share, By Type, 2022& 2031 (%)
Figure 02 Global Coated Urea Market Share, By Release Rate, 2022& 2031 (%)
Figure 03 Global Coated Urea Market Share, By Application, 2022& 2031 (%)
Figure 04 Global Coated Urea Market Share, By Region, 2022& 2031 (%)
Figure 05 Global Coated Urea Market Value, 2022-2031 ($ Million)
Figure 06 Global Coated Urea Market Y-o-Y Growth, By Type, 2018-2026 (%)
Figure 07 Polymer Coated Urea: Global Coated Urea Market Value, 2022-2031 ($ Million)
Figure 08 Sulphur Coated Urea: Global Coated Urea Market Value, 2022-2031 ($ Million)
Figure 09 Others: Global Coated Urea Market Value, 2022-2031 ($ Million)
Figure 10 Global Coated Urea Market Y-o-Y Growth, By Release Rate, 2018-2026 (%)
Figure 11 Slow-Release: Global Coated Urea Market Value, 2022-2031 ($ Million)
Figure 12 Controlled-Release: Global Coated Urea Market Value, 2022-2031 ($ Million)
Figure 13 Stabilized-Release: Global Coated Urea Market Value, 2022-2031 ($ Million)
Figure 14 Global Coated Urea Market Y-o-Y Growth, By Application, 2018-2026 (%)
Figure 15 Agricultural Crops: Global Coated Urea Market Value, 2022-2031 ($ Million)
Figure 16 Lawn & Landscape Maintenance: Global Coated Urea Market Value, 2022-2031 ($ Million)
Figure 17 Nurseries: Global Coated Urea Market Value, 2022-2031 ($ Million)
Figure 18 Others: Global Coated Urea Market Value, 2022-2031 ($ Million)
Figure 19 Global Coated Urea Market Y-o-Y Growth, By Region, 2018-2026 (%)
Figure 20 North America Coated Urea Market Value, 2022-2031 ($ Million)
Figure 21 North America Coated Urea Market Share, By Type, 2022& 2031 (%)
Figure 22 North America Coated Urea Market Share, By Release Rate, 2022& 2031 (%)
Figure 23 North America Coated Urea Market Share, By Application, 2022& 2031 (%)
Figure 24 North America Coated Urea Market Share, By Country, 2022& 2031 (%)
Figure 25 South America Coated Urea Market Value, 2022-2031 ($ Million)
Figure 26 South America Coated Urea Market Share, By Type, 2022& 2031 (%)
Figure 27 South America Coated Urea Market Share, By Release Rate, 2022& 2031 (%)
Figure 28 South America Coated Urea Market Share, By Application, 2022& 2031 (%)
Figure 29 South America Coated Urea Market Share, By Country, 2022& 2031 (%)
Figure 30 Europe Coated Urea Market Value, 2022-2031 ($ Million)
Figure 31 Europe Coated Urea Market Share, By Type, 2022& 2031 (%)
Figure 32 Europe Coated Urea Market Share, By Release Rate, 2022& 2031 (%)
Figure 33 Europe Coated Urea Market Share, By Application, 2022& 2031 (%)
Figure 34 Europe Coated Urea Market Share, By Country, 2022& 2031 (%)
Figure 35 Asia-Pacific Coated Urea Market Value, 2022-2031 ($ Million)
Figure 36 Asia-Pacific Coated Urea Market Share, By Type, 2022& 2031 (%)
Figure 37 Asia-Pacific Coated Urea Market Share, By Release Rate, 2022& 2031 (%)
Figure 38 Asia-Pacific Coated Urea Market Share, By Application, 2022& 2031 (%)
Figure 39 Asia-Pacific Coated Urea Market Share, By Country, 2022& 2031 (%)
Figure 40 Middle East & Africa Coated Urea Market Value, 2022-2031 ($ Million)
Figure 41 Middle East & Africa Coated Urea Market Share, By Type, 2022& 2031 (%)
Figure 42 Middle East & Africa Coated Urea Market Share, By Release Rate, 2022& 2031 (%)
Figure 43 Middle East & Africa Coated Urea Market Share, By Application, 2022& 2031 (%)
Figure 44 Hanfeng Evergreen: Financials
Figure 45 Everris: Financials
Figure 46 Turf Care Supply Corp.: Financials
Figure 47 Abu Dhabi Fertilizer Industries Company: Financials
Figure 48 Fertco Fertilisers: Financials
Figure 49 The Andersons: Financials
Figure 50 Yara Fertilisers India Pvt. Ltd.: Financials
Figure 51 Spic: Financials
Figure 52 VitalAgriNutrients: Financials
Figure 53 Coromandel International Limited: Financials


